- Table of Contents
- Related Documents
-
| Title | Size | Download |
|---|---|---|
| 01-text | 8.59 MB |
1.1 Introduction to WSS Cloud Engineering Survey
1.2 WSS cloud engineering survey service capabilities
1.4 Overview of WSS Cloud Engineering Survey Composition
3 Access to WSS Cloud Engineering Survey
4 Cloud Engineering Survey Process
5.4 Introduction to Collaborative Applications
5.6.4 Application scenario settings
5.7 General Procedure of Drawing Scheme
1 Overview
1.1 Introduction to WSS Cloud Engineering Survey
H3C cloud engineering survey is a cloud engineering survey simulation software launched by H3C , which greatly saves the manpower and material resources during the on-site engineering survey of wireless projects.
Through the mapping of the wireless project site environment by engineers, H3C cloud engineering survey can intuitively view the coverage effect of WLAN on the site and generate engineering survey map, which greatly improves the efficiency of wireless project site engineering survey.
The core of H3C cloud engineering survey is to render the coverage intensity range of AP (wireless access point) and generate engineering survey map by simulating the environment. All the functions are to generate more accurate cloud engineering survey map. AP (wireless access point) is divided into installation type, outdoor type, x-share, panel type. The type and thickness of the obstacle can be set, and the attenuation of the obstacle to the wireless signal can be checked. When new engineering survey map is built, the corresponding industry and environment can be selected. The system is built into 9 major industries and 27 kinds of environments, which fully supports the engineering survey needs of various industries and environments, and supports the user-defined environment, making it more flexible and convenient. The system built-in H3C common AP model, which can meet most of the use cases. At the same time, it supports the addition of an AP model that is not preset in the system, and the existing AP model supports the modification of the transmission frequency. Users can view the simulation diagram, weak field diagram and point bitmap according to their needs, and quickly understand the required material model and quantity through the bill of materials and engineering survey report of the whole project, as well as whether it can meet the signal requirements.
1.2 WSS cloud engineering survey service capabilities
With the continuous development of the Internet, users' demand for wireless network access is also increasing. The performance of wireless products has been greatly improved, but there are still bottlenecks in some special situations. In addition to the technical evolution of wireless products, engineering survey is particularly important to solve these issues.
During the project implementation process, using cloud engineering survey tools will shorten the project implementation cycle, reduce the AP (Access Point) point error and the error rate after real deployment, and provide customers with a high-quality wireless signal coverage network experience. Considering to ensure the wider coverage of H3C wireless networks and giving full play to the performance advantages of H3C wireless network equipment, H3C launched the WSS Cloud Engineering Survey. The tool can simulate a variety of wireless coverage application scenarios, and through simulation surveys to meet customers' wireless network coverage requirements.
By importing engineering pictures in jpg, bmp, or png formats, one-click simulation deployment, accurate AP deployment planning, and transparent presentation are organized. Regarding the quality of wireless coverage signals, by simulating obstacles (walls, glass, and other media) and attenuating the wireless signal, turning on the wireless AP scene coverage mode,you can clearly simulate the signal effect of the wireless AP after deployment. Regarding the signal dead zone, the correction effect can be guaranteed by subtle correction. The flexible output report effectively supports the communication between engineers and customers on how to optimize the network scenario design for high-density and high-traffic complex scenarios.
H3C WSS Cloud Engineering Survey (Wireless Site Survey) is launched for the deployment of H3C wireless AP. It provides effective AP deployment, engineering survey simulation, and solution planning effect output with minimal time and easy operation, which reduces the complexity of operations, concise and efficient deployment and maintenance of wireless networks.
H3C WSS cloud engineering survey simplifies wireless network deployment,check wireless signal coverage, and gives users a good access experience, effectively solving wireless networks problems such as poor coverage quality and unsatisfactory Internet speed experience due to incomplete survey and deployment.
l Cloud engineering survey is an important part to ensure the experience of wireless network delivery;
l Use tools to simulate the customer's environment, submit engineering survey reports to customers in conjunction with on-site surveys, and provide suggestions on the number of equipment and auxiliary materials to ensure customer experience;
l Software simulation is required in the engineering survey report to support the survey report data.
1.3 Tool Interface Layout
Main page

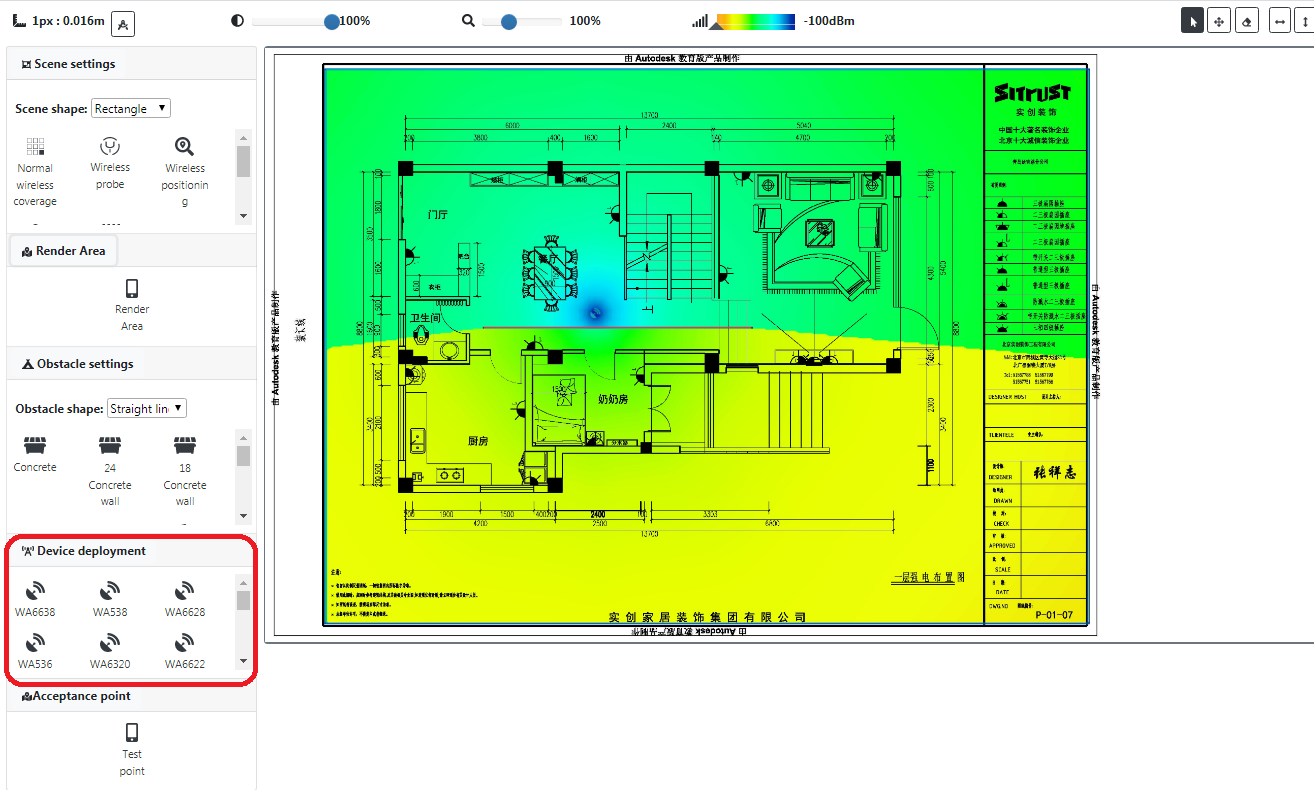
Figure 1-1 Rendering page
l Project management: It can manage projects and schemes, draw engineering survey drawings, view renderings, bills of materials, and download engineering survey reports.
l Rendering area (scheme designer): The scheme designer is the core function of the cloud engineering survey tool. It is used to draw engineering survey maps, and generates simulated signal simulations by combining obstacles, APs, and scenes.
l Basic data: Basic setting area. User-defined additions and modifications for basic parameters, including AP devices, obstacles, environments, and application scenarios.
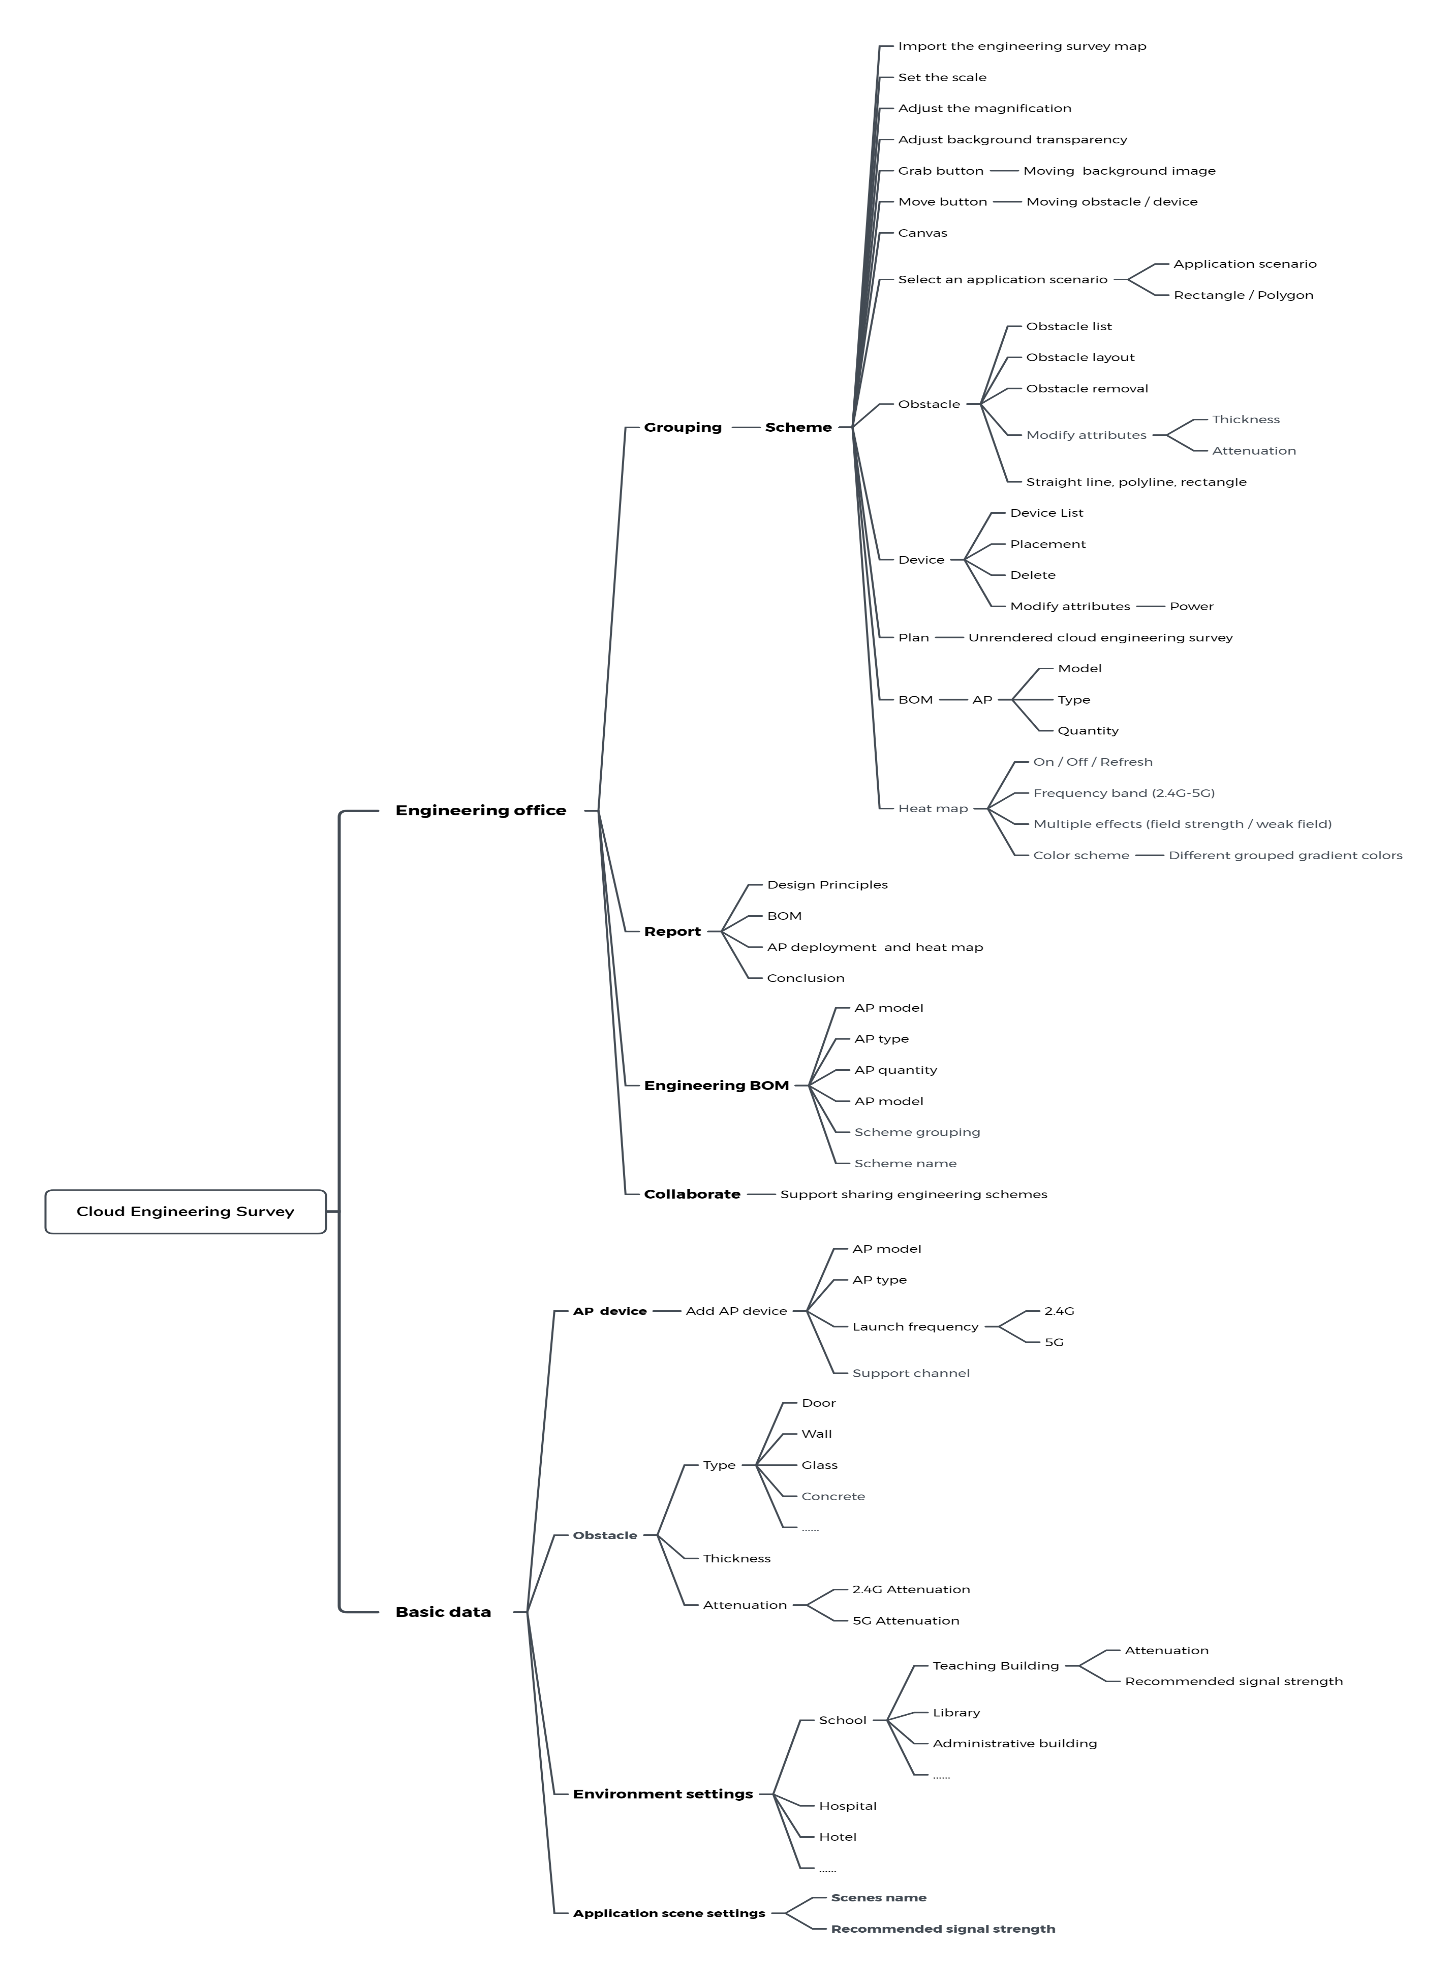
1.4 Overview of WSS Cloud Engineering Survey Composition
2 Software installation
Cloud engineering survey tools are installed and deployed on the cloud-net platform by engineers in the software development department, and do not require user’s operation.
3 Access to WSS Cloud Engineering Survey
(1) Open your browser and enter https://oasiscloud.h3c.com in the address bar to enter the H3C cloud-net platform login page. Register and log in to the cloud-net platform.
(2) Select the [Network Management / Business Components / Cloud Engineering Survey] menu item to access the cloud engineering survey.
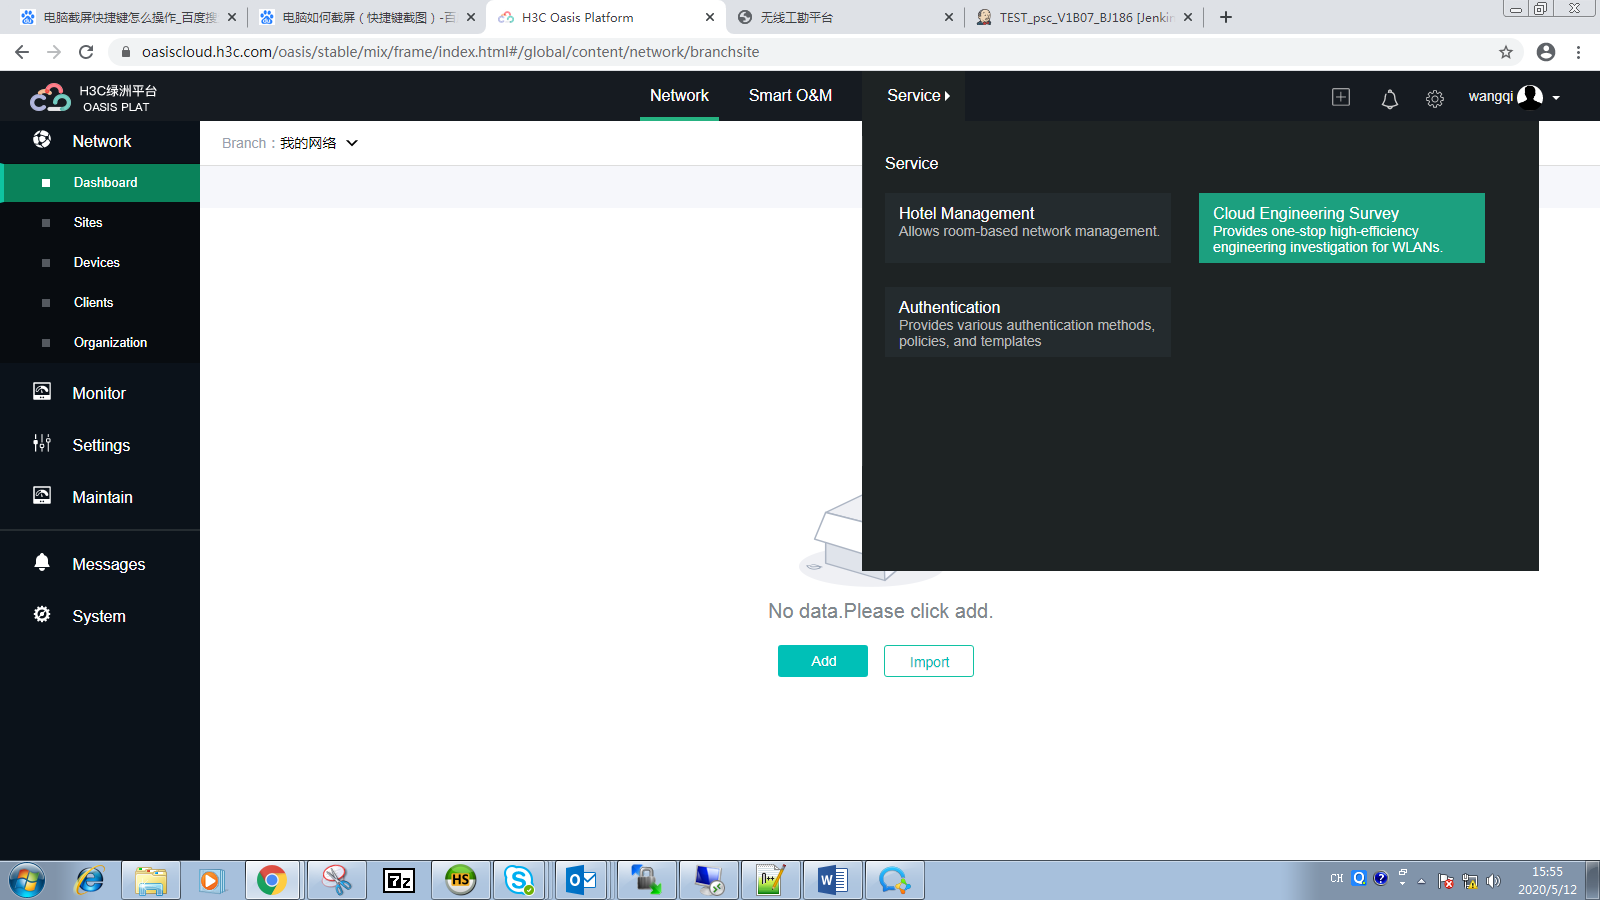
(3) You can also open a browser and enter https://oasiscloud.h3c.com/wss/,Visit Cloud Engineering Survey after successful certification.
To ensure the normal use of WSS cloud engineering survey, please use Firefox or Google Chrome. For Firefox, Firefox 66.0.2 or higher is recommended; for Google Chrome, Google Chrome 74.0.3724.8 or higher is recommended. (If the browser version is too low, you can try it, but the page integrity is not guaranteed).
4 Cloud Engineering Survey Process
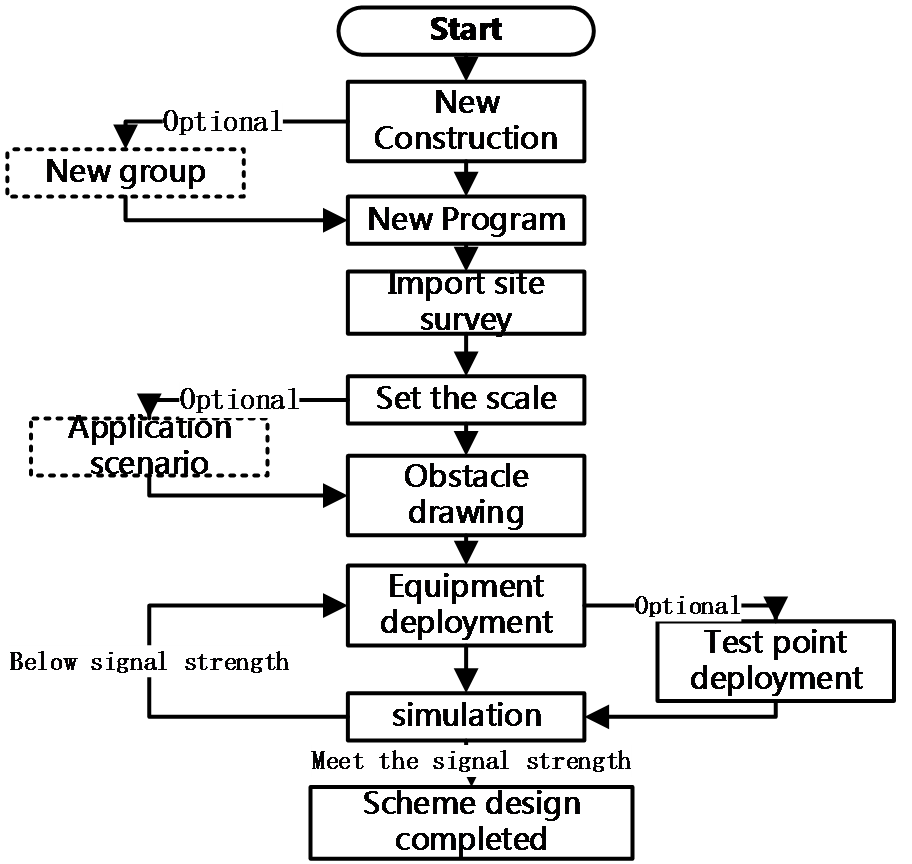
Figure 4-1 Cloud engineering survey process
(1) Create an engineering scheme
According to actual needs, create a plan
that requires engineering surveys in the project plan management.
(2) Import the engineering survey map
In the process of using H3C cloud
engineering survey to draw an engineering survey map, you must first import the
engineering survey map before you can design AP points and draw obstacles.
(3) Simulation environment
According to the actual environment of the
AP deployment site, draw obstacles and deploy APs.
(4) Generate engineering survey plan
Use the engineering survey tool to simulate the engineering survey map of the wireless project site environment to determine the model, quantity, and placement location required by the AP.
5 Engineering management
Engineering Management Includes the main functions of cloud engineering survey tools: engineering office, engineering bills of materials, engineering schemes, project collaboration, scheme results, scheme designers.
5.1 Engineering Office
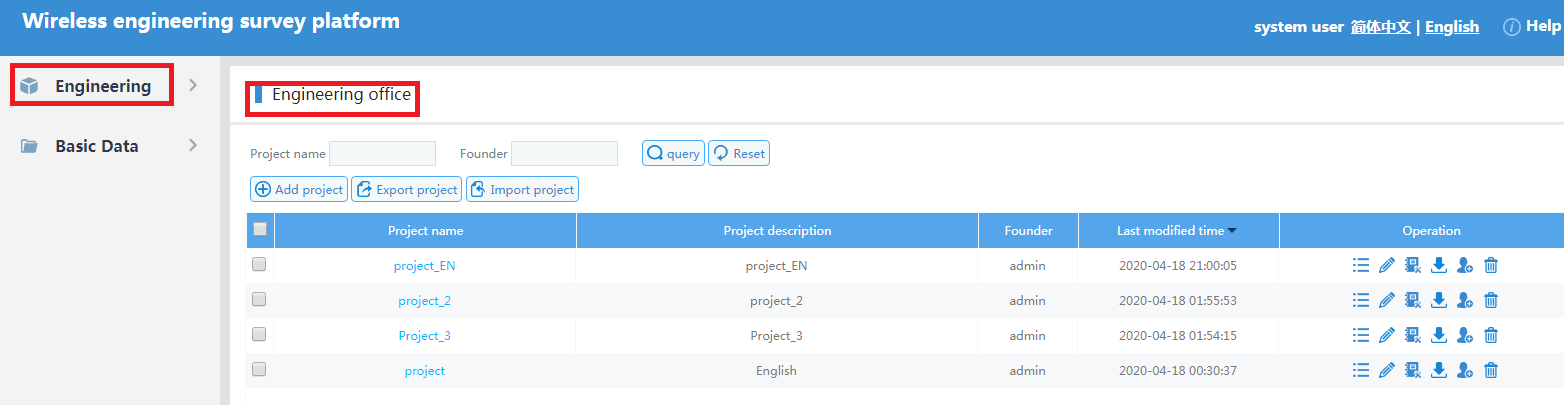
5.1.1 Project List
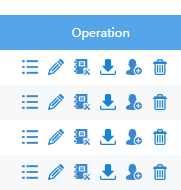
Pagination display: project name, project description, creator, last modification time, operation (view project plan, edit project information, project bill of materials, download report, collaboration, delete).
Explanation:
By default, the list is displayed in order of project creation time.
(1) Log in to the H3C WSS Cloud Engineering Survey, select the [Project Management] menu item in the left navigation, and enter the engineering office page, as shown in the figure below.
Figure 5-1 Engineering office
5.1.2 Query Bar
Engineers can enter the project name, creator, and search for the desired project (fuzzy search by defauilt).
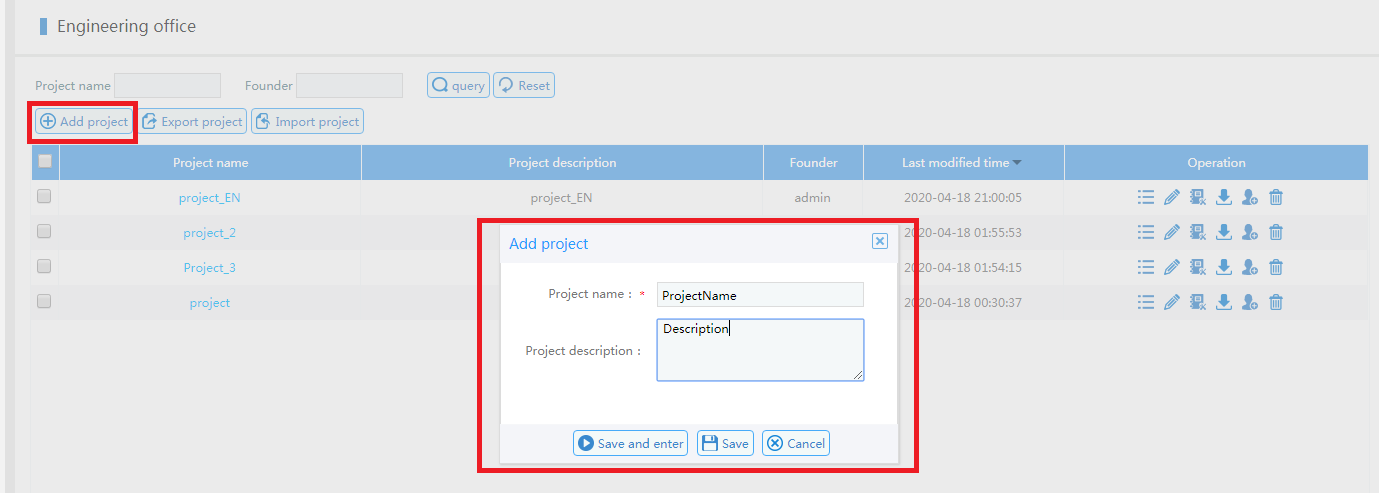
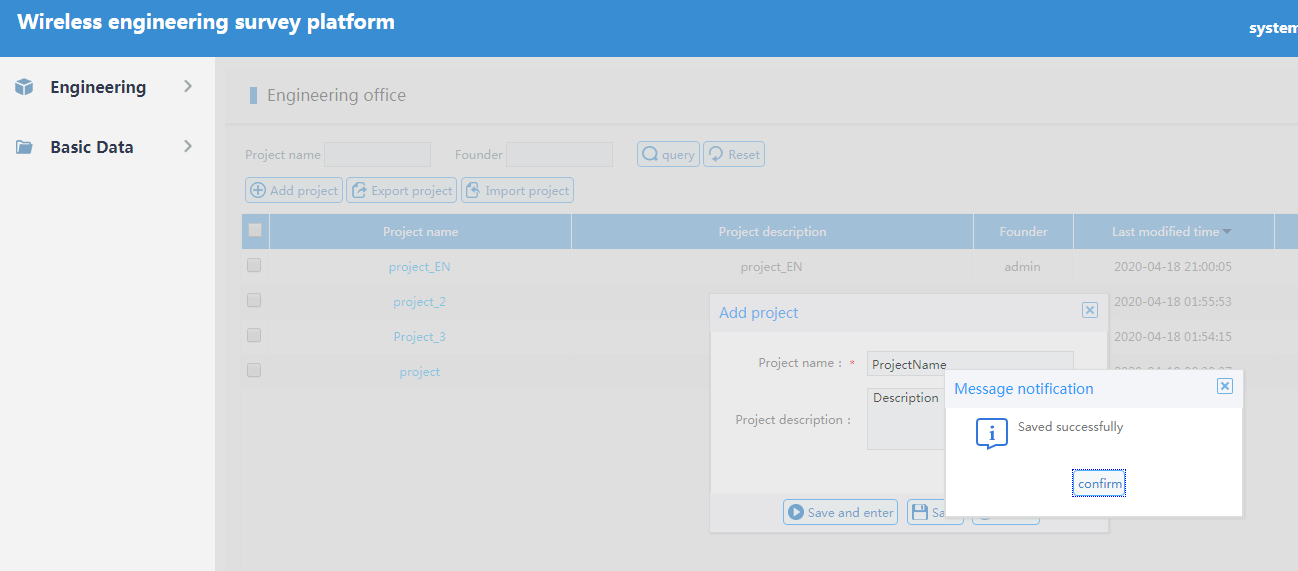
5.1.3 Add Project
(1) Click the <Add Project> button. A pop-up window for adding a project is displayed. Enter the project name and project description.
(2) Click <Save and Enter> to complete the project addition and enter the project plan page of the engineering office.
Figure 5-2 Adding a project
5.1.4 Engineering shortcuts
(1) In the project list, click the corresponding "Project Name" to turn to the [Project Scheme] page of the corresponding project.
Figure 5-3 Engineering solution portal
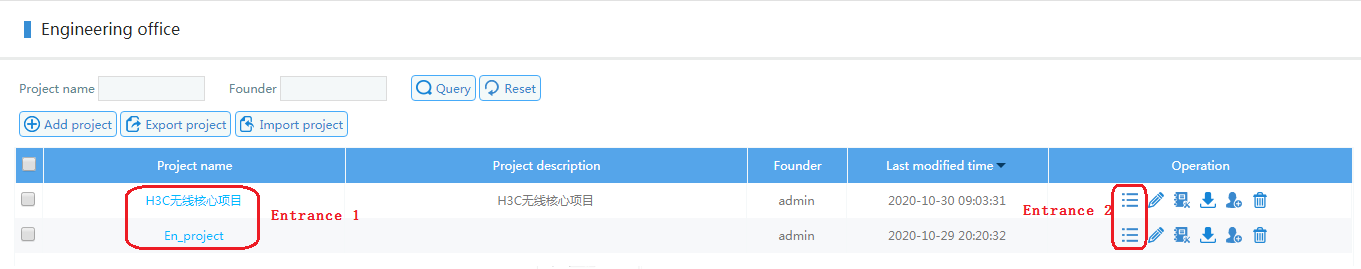
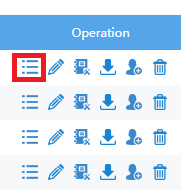
(2) View project plan button: Click the button to turn to the [Project Plan] page of the corresponding project.
Figure 5-4 View project plan
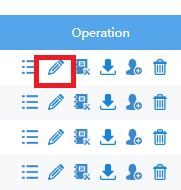
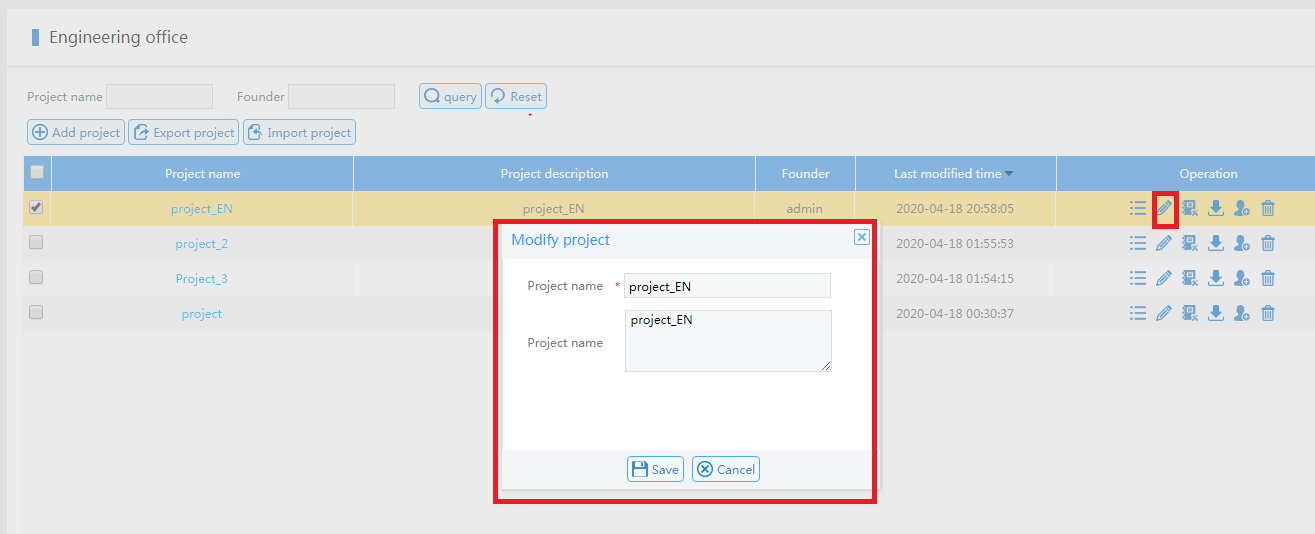
(3) Edit project information button: Click the edit button to pop up the Modify Project window to modify the project name and project description.
Figure 5-5 Editing the project plan
(4) Engineering BOM button: Click the button to turn to the [Engineering BOM] page.
Figure 5-6 Engineering physical inventory

(5) Download report: Click the button to download the report of the corresponding project. The customization of report content elements is supported,which contains five modules: basic information, design principles, bill of materials, AP deployment location and heat map, and conclusion.
Figure 5-7 Download report
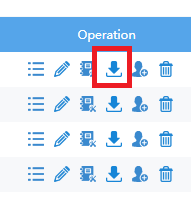
Figure 5-8 Report content customization
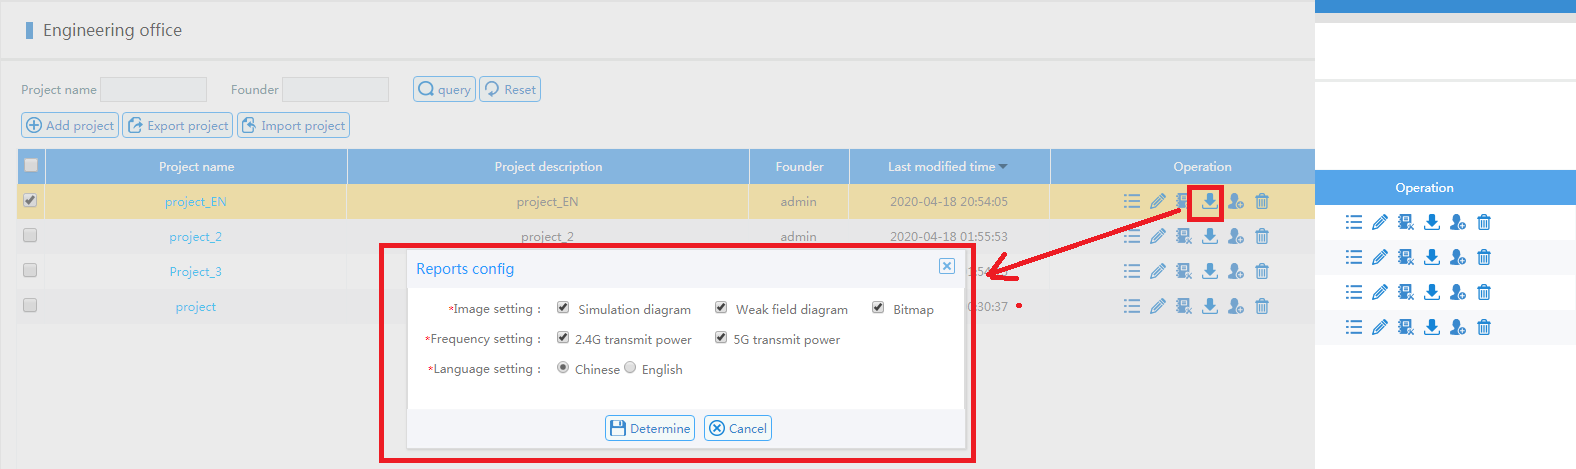
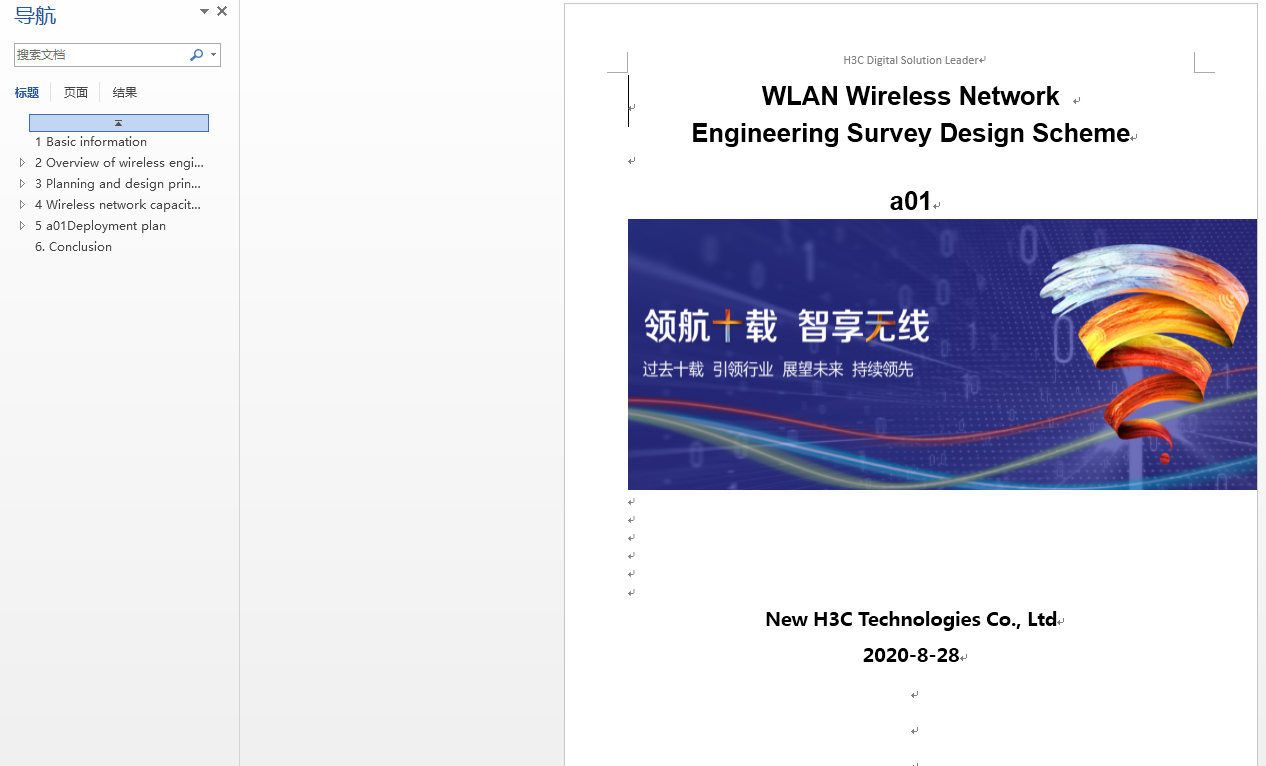
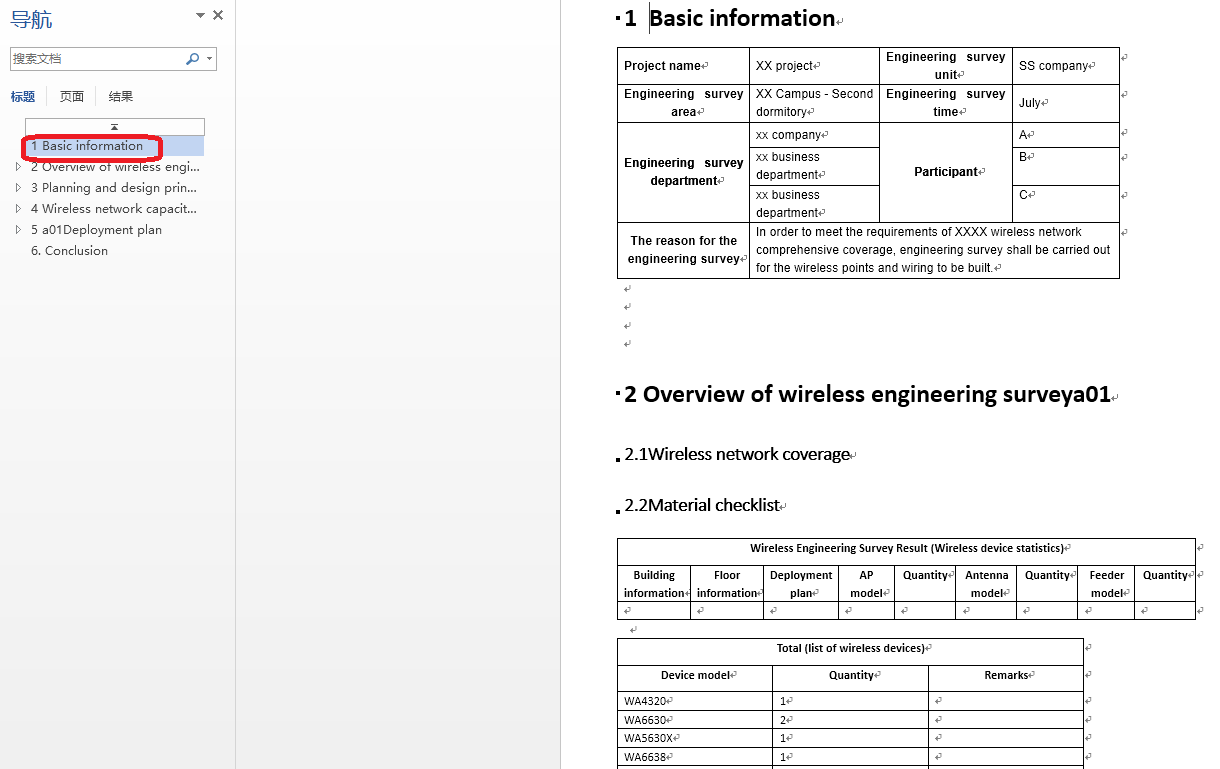
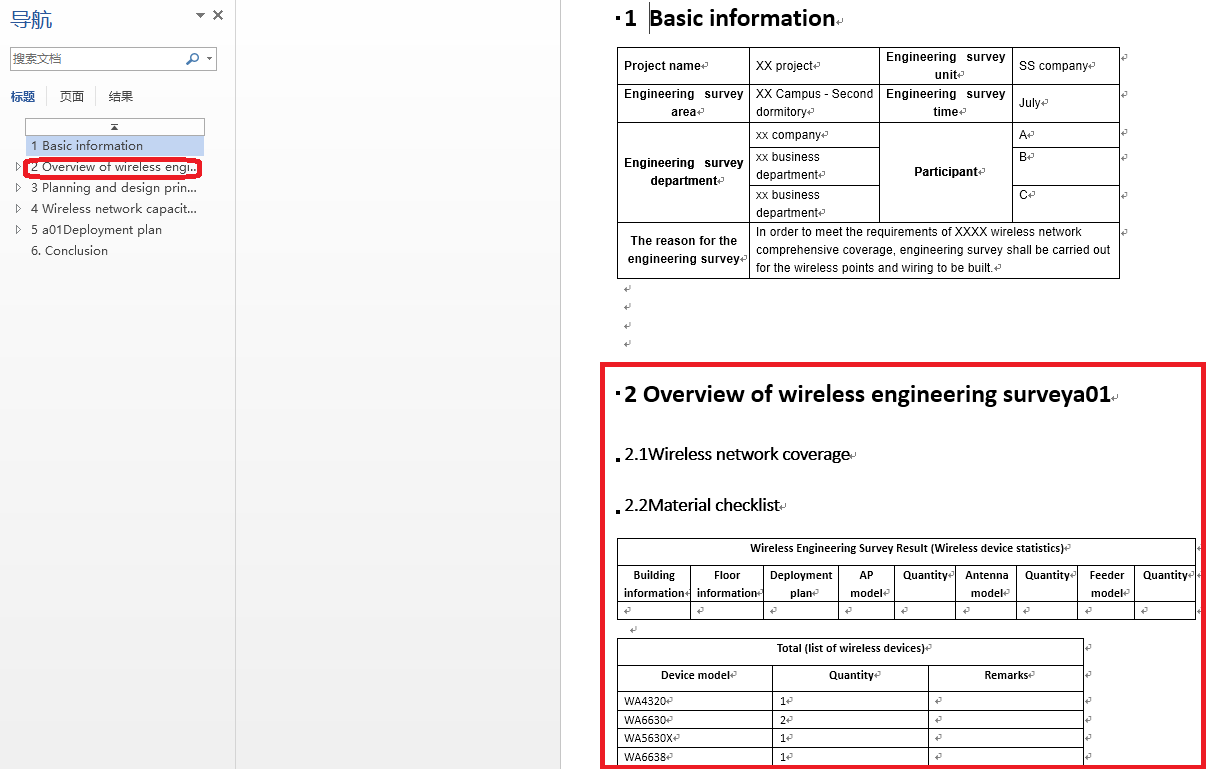
Figure 5-9 Sample report
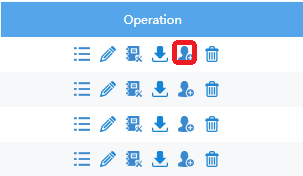
(6) Collaboration button: Click the button to pop up the [Collaboration] window. One project supports multiple people to cooperate and complete at the same time. It is necessary to add a collaborative person (the user name of the cloud-net account). After the addition is successful, the corresponding person can perform corresponding operations on the collaborative project.
Figure 5-10 Collaboration
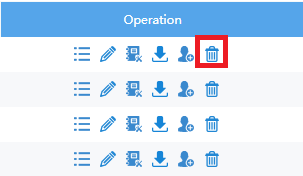
(7) Delete project button: Click the button to delete the corresponding project. It cannot be deleted when a scheme exists in the project. If the collaborator deletes the shared project, it is equivalent to actively disassociating the project from itself.
Explanation:
If there is an associated engineering scheme with current scheme, it cannot be deleted.
Figure 5-11 Delete project
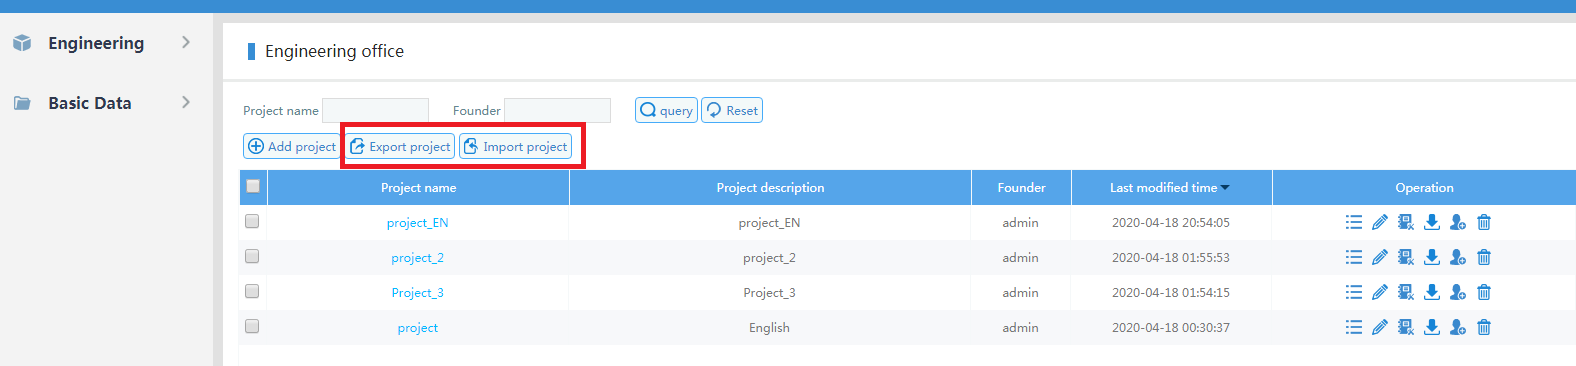
(8) Export project: The project supports export and also supports batch export of multiple selected projects. It is used to connect cloud-net data with local cloud-net data. Collaborative users cannot export projects created by other users.
(9) Import project: It supports importing projects exported by other users to the current user. After importing, the project becomes a project created by the current user, and the contents of modification or deletion can be viewed normally.
Figure 5-12 Export and import project
5.2 Engineering BOM
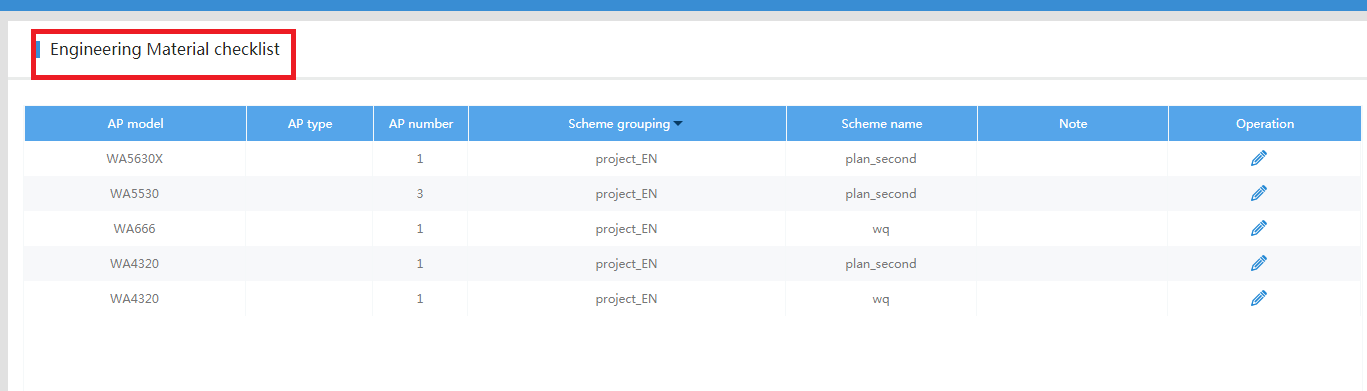
The BOM of the project displays the AP equipment required by the dimension of the project. By default, the AP model, type, and quantity required for each project are displayed.
5.2.1 List
List display: AP
model, type, quantity, scheme grouping (if it is a multi-level grouping connected
with "-" according to the hierarchical relationship, such as:
dormitory building-20), scheme name (the scheme name of the AP equipment),
remarks, action (you can edit button but only edit notes).
(1) Log in to the H3C WSS Cloud Engineering Survey, and select the [Project Management] menu item in the left navigation to enter the engineering office page.
(2) Click the
Engineering BOM icon ![]() in the corresponding operation column of
the project to turn to the Engineering BOM page.
in the corresponding operation column of
the project to turn to the Engineering BOM page.
Figure 5-13 Engineering BOM page
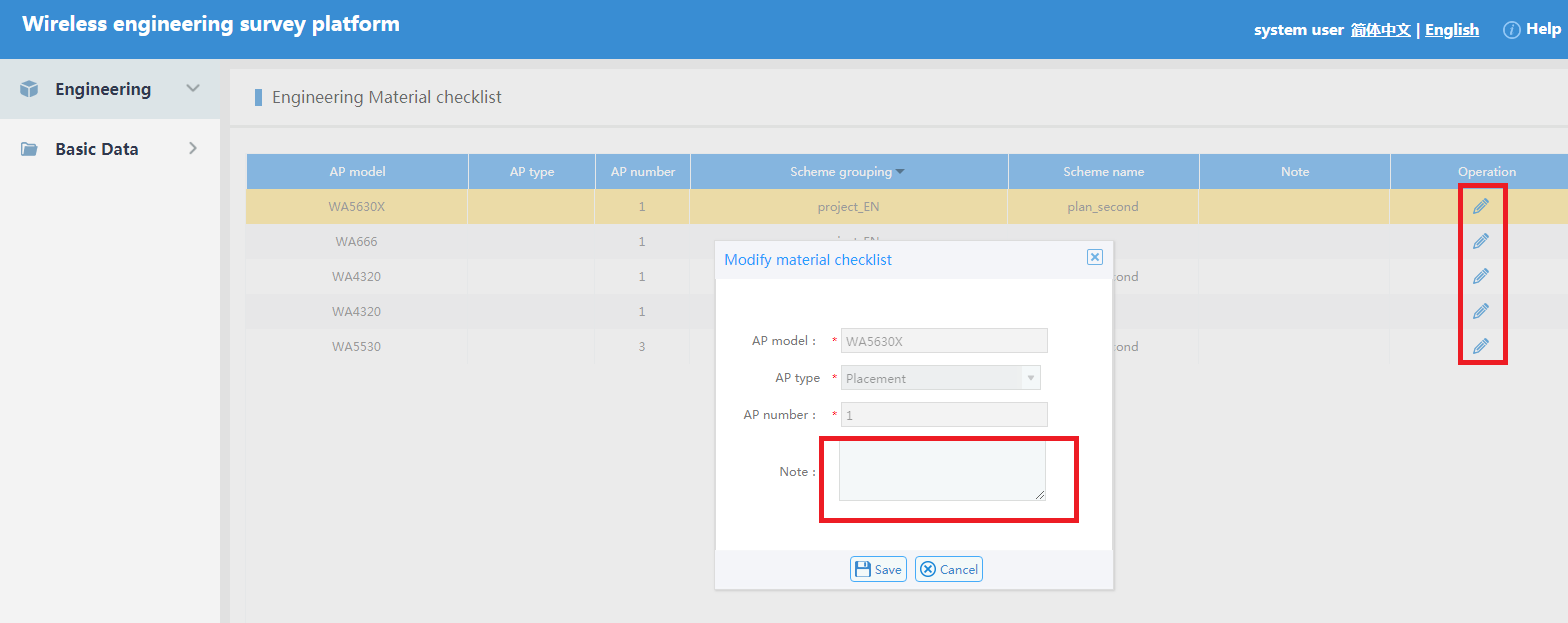
5.2.2 Modifying Materials
Explanation:
l The column edit button![]() can only edit the remarks.
can only edit the remarks.
(1) Click the edit icon![]() in the action bar to
pop up the Modify Material window.
in the action bar to
pop up the Modify Material window.
(2) Modify the remark information.
Figure 5-14 Modifying material notes
5.3 Collaboration
(1) Log in to the H3C WSS Cloud Engineering Survey, and select the [Project Management] menu item in the left navigation to enter the engineering office page.
(2) Click the
collaboration icon ![]() in the corresponding operation column of
the project to turn to the [collaboration] page.
in the corresponding operation column of
the project to turn to the [collaboration] page.
Figure 5-15 Collaboration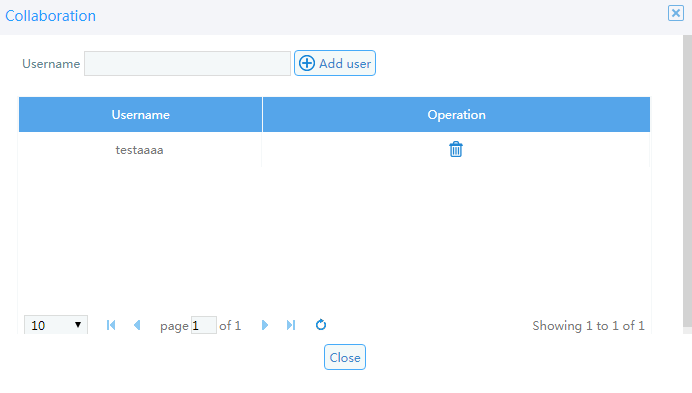
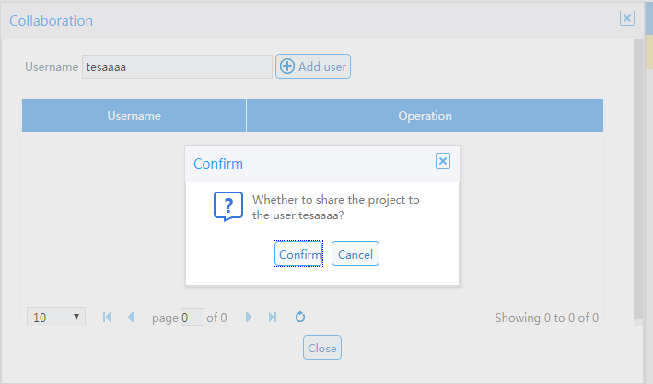
(3) Add user: Enter the user name and click the <Add User> button. If the user name exists, a confirmation option will pop up. If it does not exist, it prompts that: the user does not exist, please enter the correct user name.
Figure 5-16 Adding users
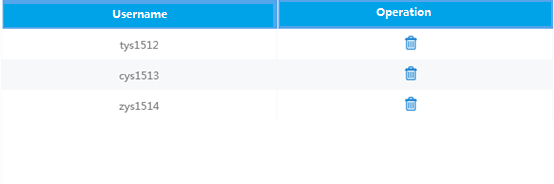
(4) List: The list contains the user name and operation bar (disassociation), and a list of users associated with the current project. The same project supports to cooperate to complete a project at the same time, and it is necessary to add cooperating personnel. After the addition, the corresponding personnel can perform corresponding operations on the collaborative project.
Figure 5-17 User list
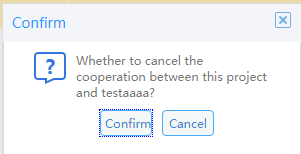
(5) Click the disassociate
icon![]() in the operation bar to disassociate the
associated user from the project.
in the operation bar to disassociate the
associated user from the project.
Figure 5-18 Disassociate
5.4 Introduction to Collaborative Applications
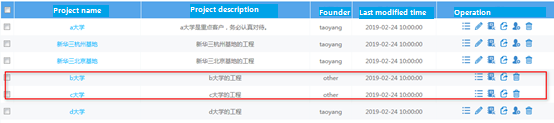
l When a project is coordinated and collaborated (the project is created by employee A, and collaborators B and C are created at the same time), the collaborators (collaborators B and C) have the limited authority to collaborate on the project.
l Collaborators (employees B and C) cannot modify the project name and project description, they can view the bill of materials and download the engineering report, but the collaboration function is not displayed to the partners (Employees B and C are not allowed to use the new collaboration function to create a new collaboration person). The deletion of the cooperation item by the collaborator is to disassociate the collaboration and won’t delete the creator's project.
l Collaborators (Employees B and C) do not have rights to modify or delete project groups created by others. The partners (employees B and C) can not delete, modify, or design the solution created by others. The specific solution partner can only view the solution results, and the other buttons are hidden.
l The authority of the collaborator on the project site page: there are four icons in the operation bar : view the project plan, the bill of materials, download the report, and disassociate (click the delete button, the collaborator will disassociate with the related project passively, but will not affect the display of the project on other people's page)
The authority of the collaborator on the project site page:
(1) The project was created by the user himself: the user has all rights to edit, modify, and delete schemes and groups created by partners.
(2) The project was created by someone else, and the user is a collaborator: the user has rights to the root node and the group of the project (you cannot delete a group when there is a solution under the group), and you have only the permission to view the results of the solution, and the other buttons are hidden.
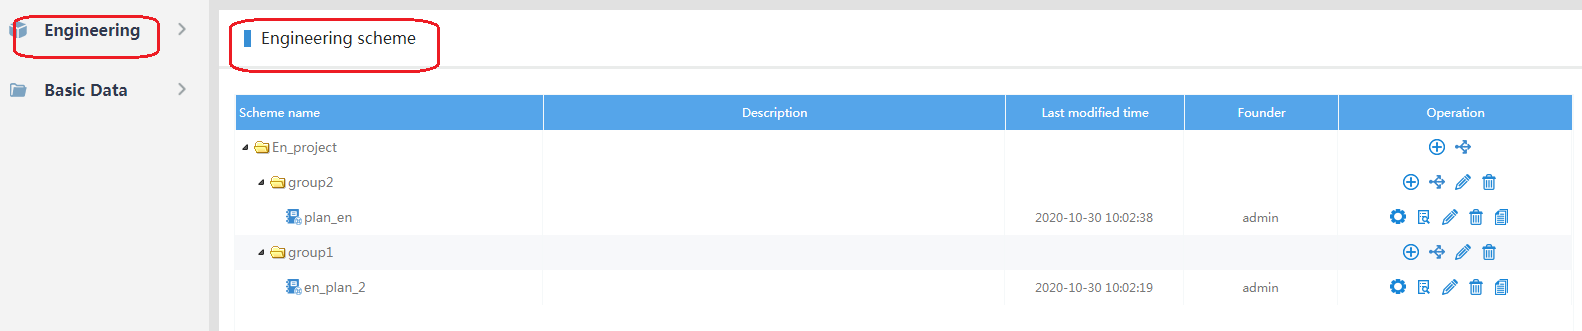
5.5 Engineering scheme
The project solution can be managed through the engineering solution, including adding, deleting, modifying, and viewing functions.
(1) Click the "Project Name" on the project site page or view the project plan button to turn to the project plan page.
Figure 5-19 Entering the project plan page

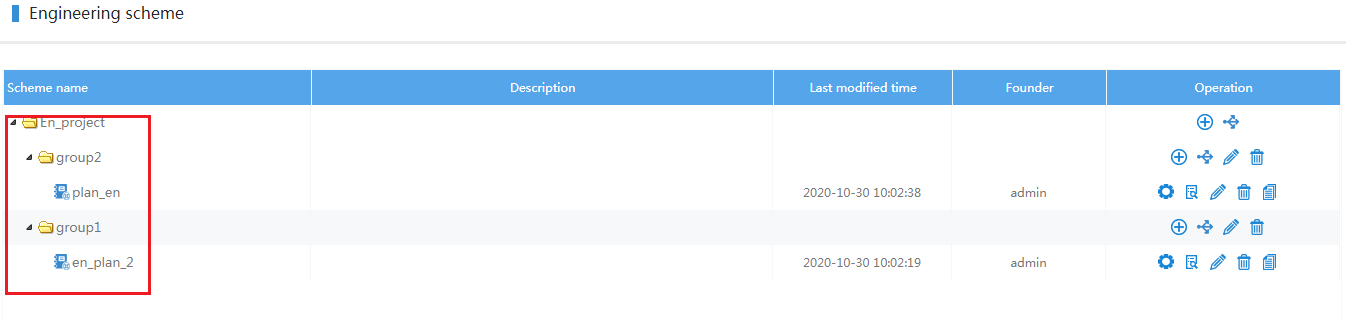
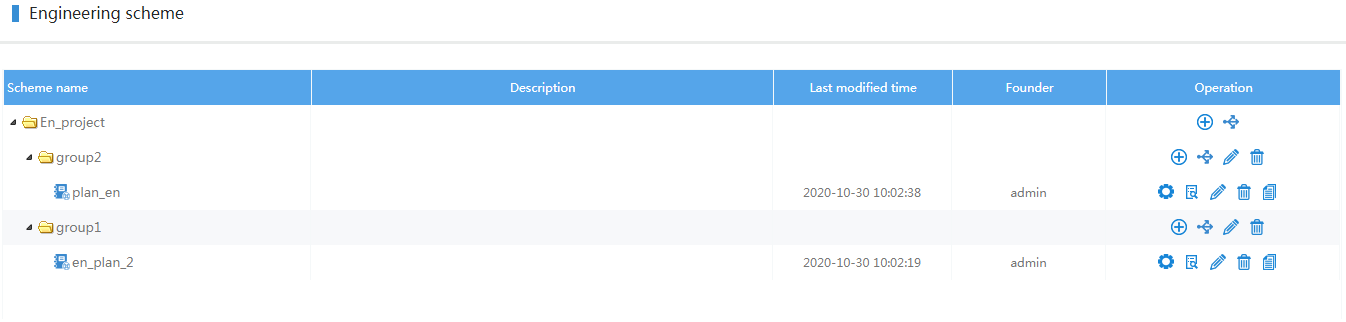
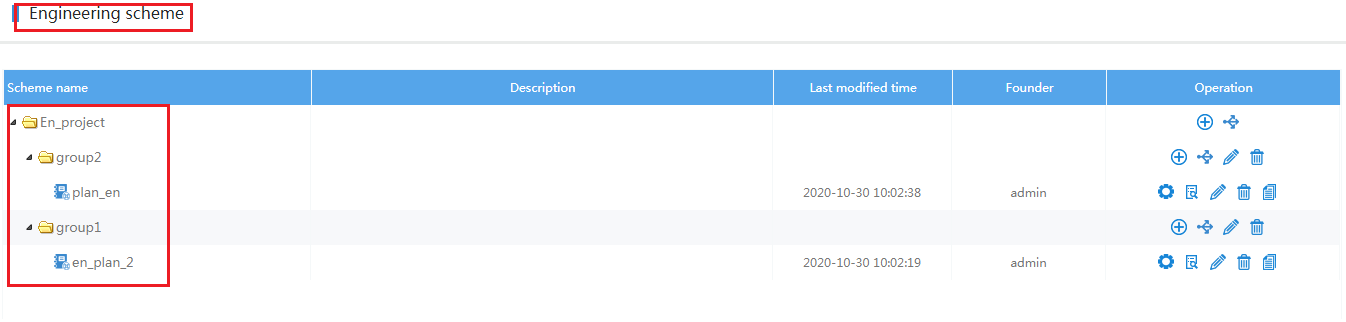
(2) Scheme list: Show scheme name, description, last modification time, creator, operation.
Figure 5-20 Project plan list
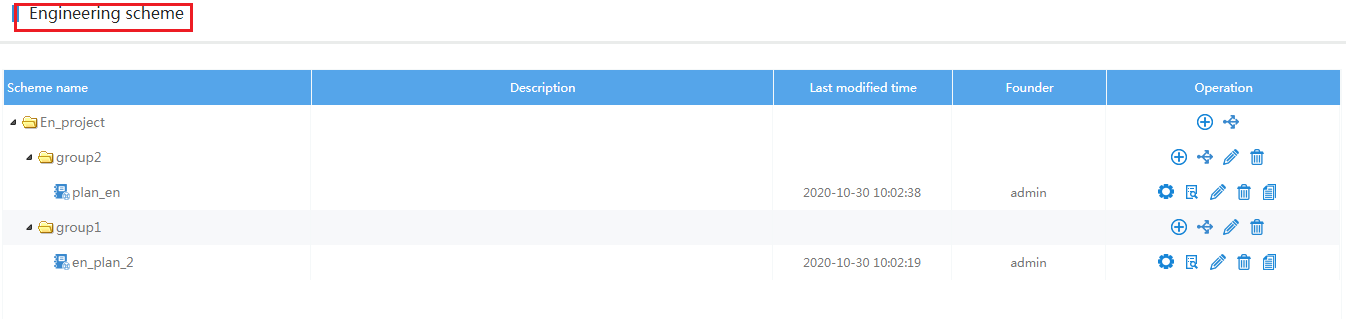
Explanation:
Scheme name: The scheme name is displayed hierarchically in a tree structure. The root node is the name of the engineering office, which can be grouped by multiple levels. There can be schemes under the engineering office and the grouping but no grouping or scheme under the project scheme of the newly-built project site.
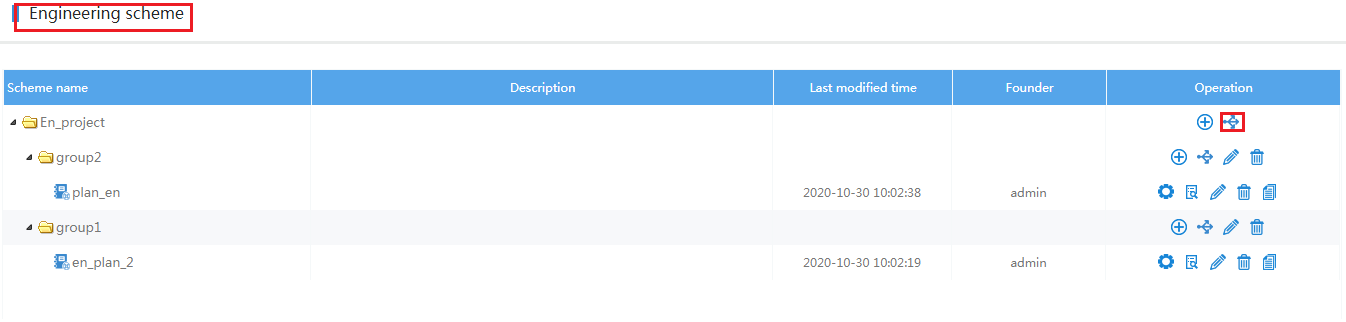
(3) Adding a group: You can add a group directly under the engineering office, or you can add a group under the group. There is no upper limit on the group level.
Figure 5-21 Adding a group
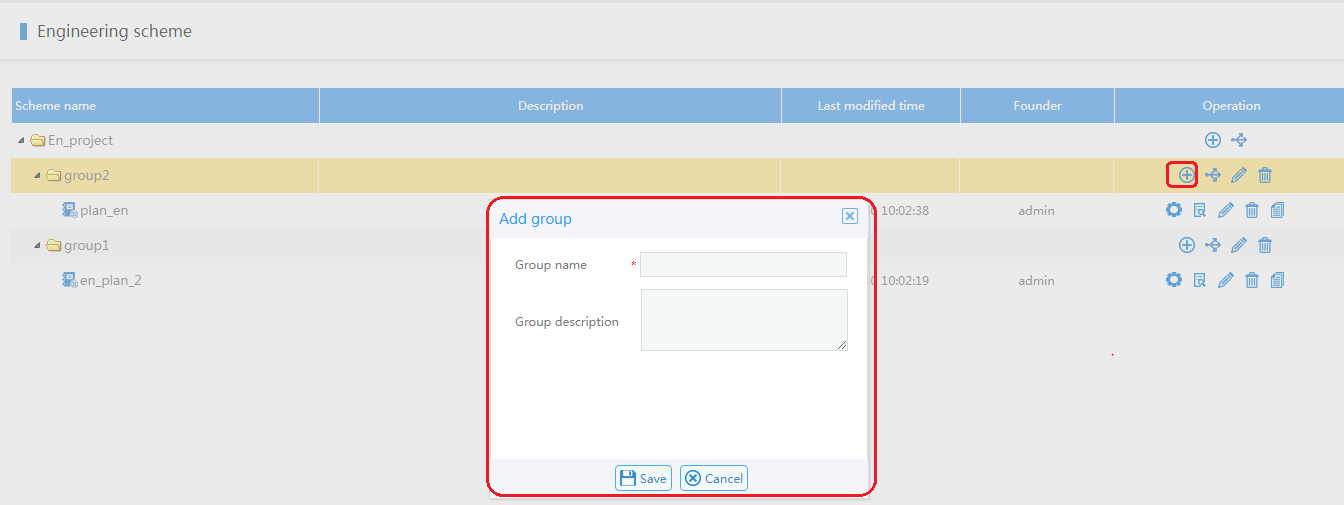
(4) Click the Add button to pop up the Add Group window, and input the group name and group description.
Figure 5-22 Adding group parameters
(5) Modify group: Click the modify icon![]() in the group operation bar to pop up the group information window. You
can modify the group name and group description.
in the group operation bar to pop up the group information window. You
can modify the group name and group description.
(6) Adding a scheme: You can add a scheme directly under the engineering office, or you can create a new group first, then create a new scheme in that group.
Figure 5-23 Adding a scheme
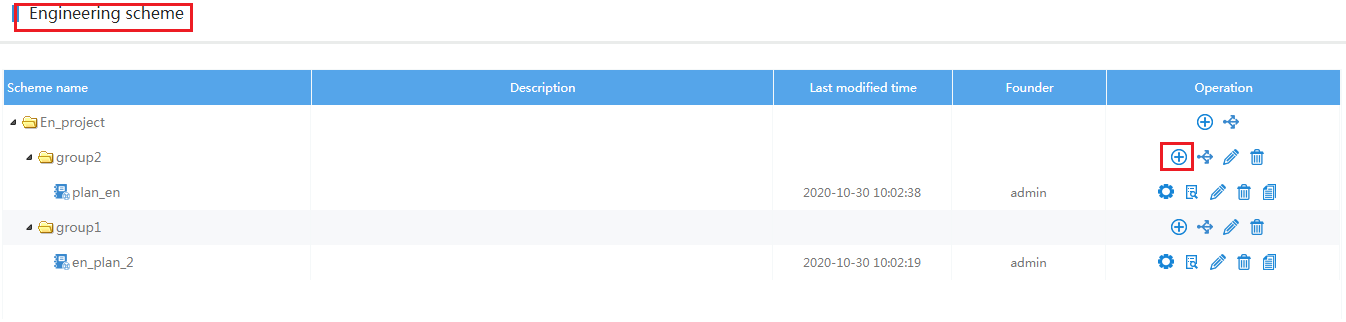
(7) Click the
corresponding icon ![]() to pop up the Add Scheme button. The input
information includes the scheme name, industry classification, environment name,
and scheme description. Click the <Save and Design> button to directly
enter the [Solution Designer] interface.
to pop up the Add Scheme button. The input
information includes the scheme name, industry classification, environment name,
and scheme description. Click the <Save and Design> button to directly
enter the [Solution Designer] interface.
(8) Different environments correspond to the overall default minimum field strength of different solution designers. When the field strength is less than this value, the signal does not meet the standards. The environment also specifies the overall attenuation coefficient, allowing users to customize the environment in the basic data menu.
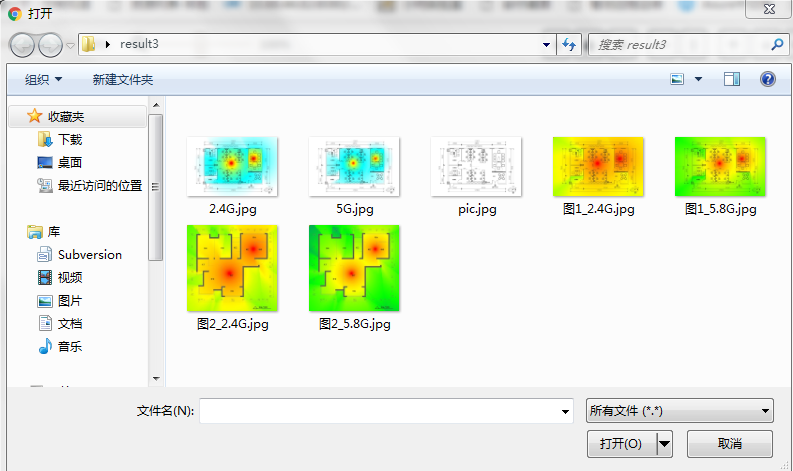
(9) Different industry classifications correspond to the common environment names of the industry. At present, the system has built-in 9 industry classifications and 27 specific environments. The user can customize and add the environment. When creating a new plan, you need to import the original engineering survey plan (pictures in jpg, bmp, png format).
Figure 5-24 Adding a scheme
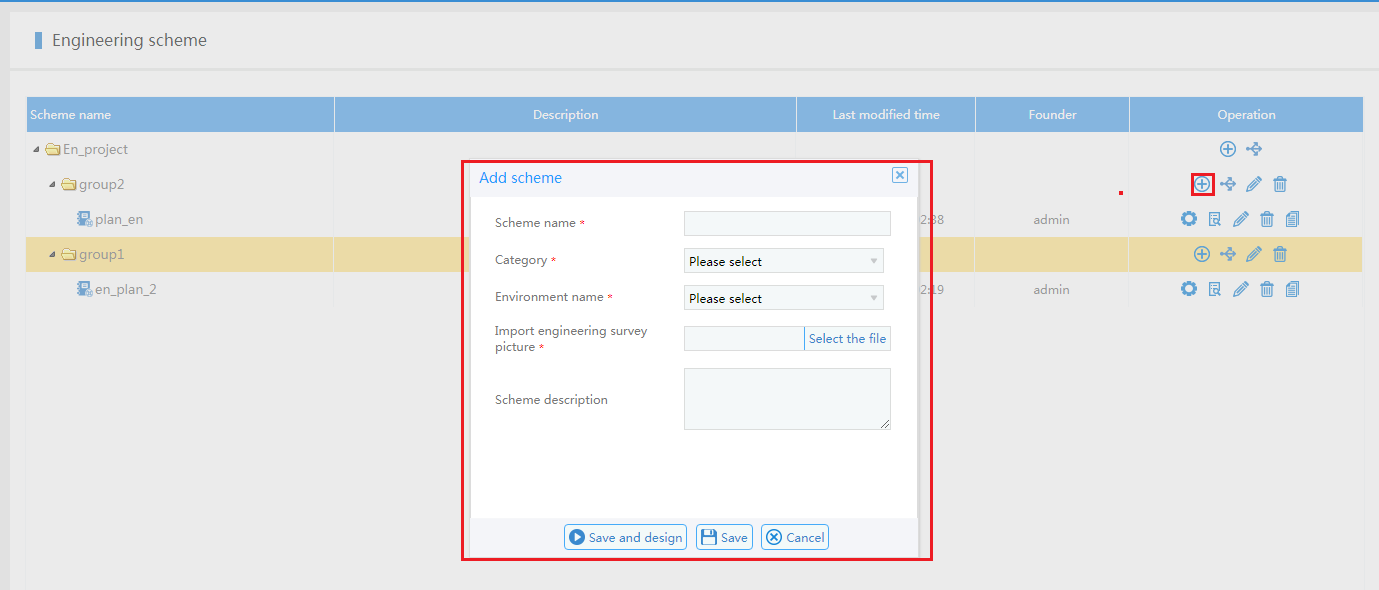
Figure 5-25 Importing engineering surey
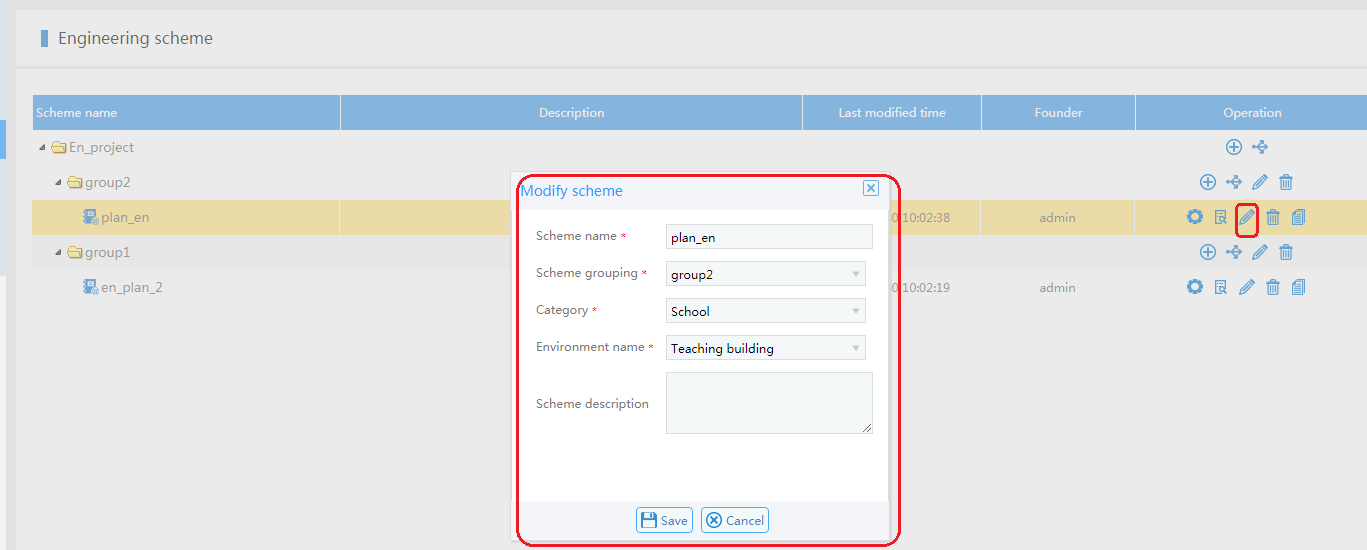
(10) Modify the plan: Click the modify button in the action bar of the plan to pop up the modify plan window. You can modify the basic information of the plan, including the plan name, plan group, industry classification, environment name, and plan description. You can move the solution to the project root or any other group.
Figure 5-26 Modify plan
(11) Copy plan: Click the copy button in the plan operation bar to copy the current plan in the same group
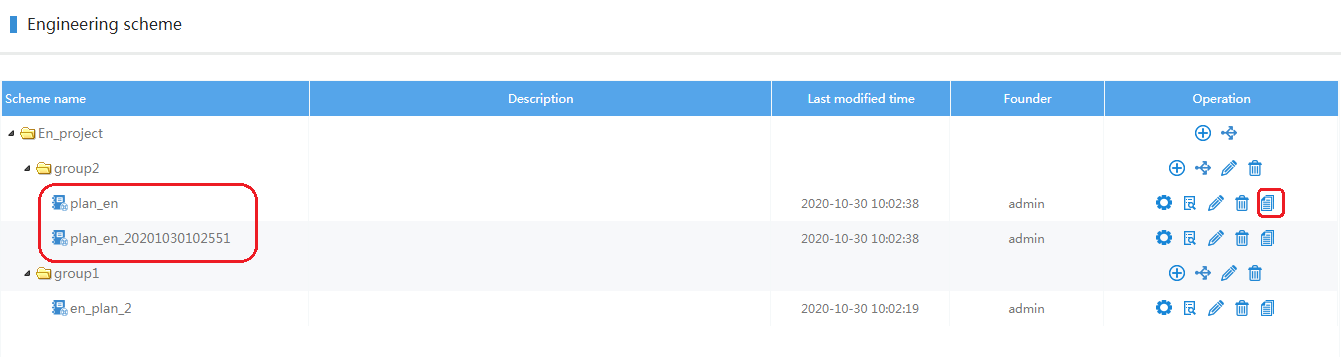
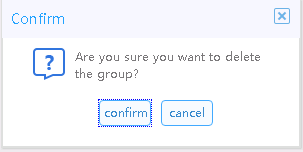
(12) Delete: You can delete the scheme and group by clicking the icon![]() in the corresponding operation column of the scheme and group. When
there is a scheme under the group, you cannot directly delete the group.
in the corresponding operation column of the scheme and group. When
there is a scheme under the group, you cannot directly delete the group.
Figure 5-27 Delete group and plan

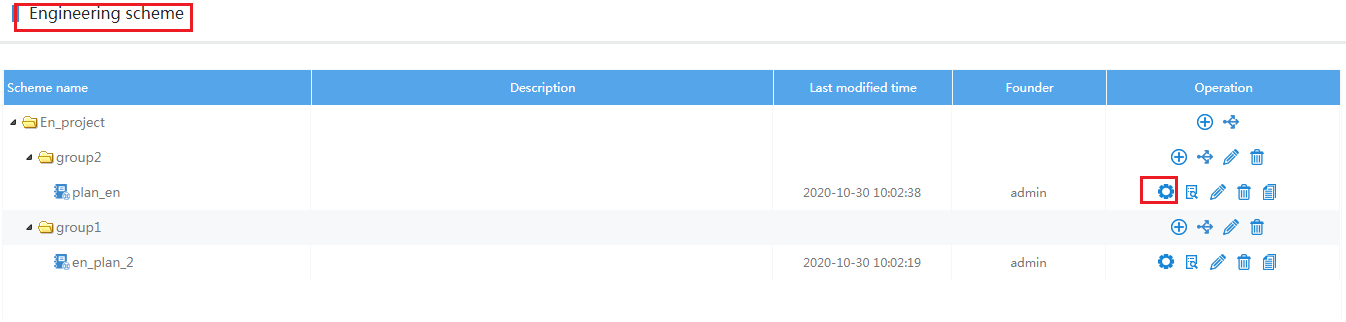
(13) Scheme design: Click the scheme design button under the scheme operation column, new tab page opens the [scheme designer] page (in addition, when creating a scheme, you can also enter the designer page after saving and designing).
Figure 5-28 Scheme design
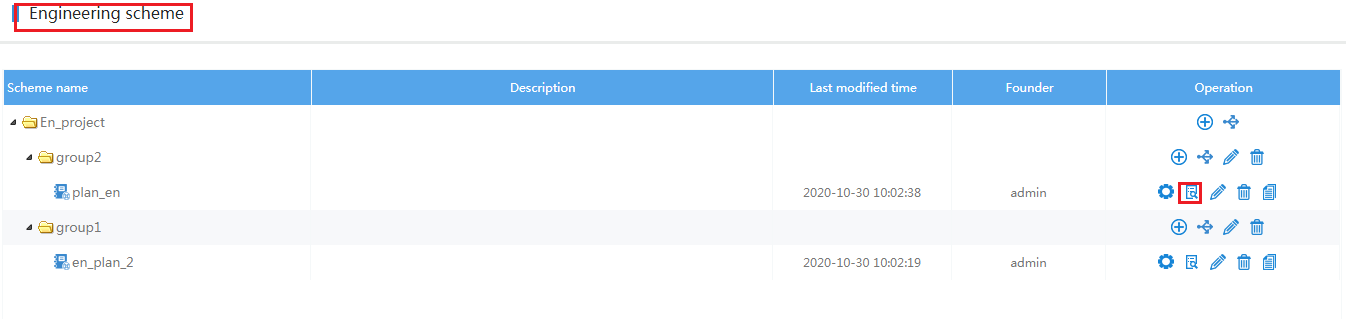
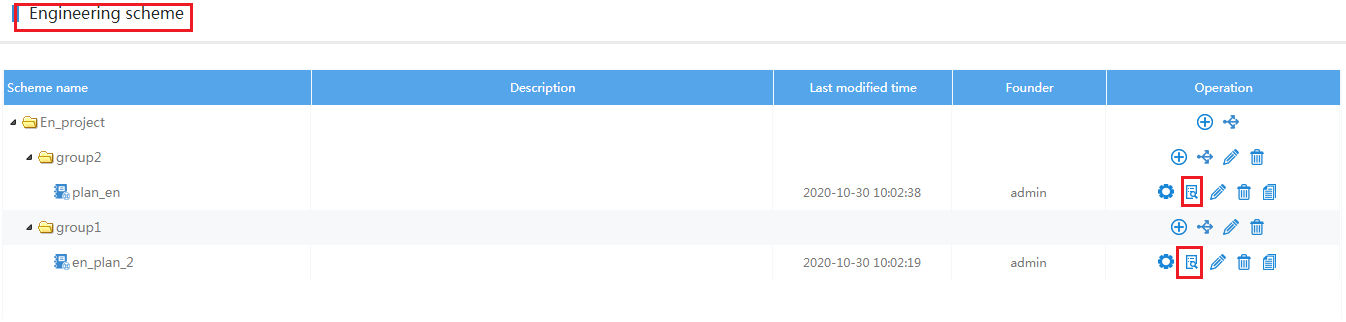
(14) Scheme result: Click the scheme result button under the scheme operation column to turn to the scheme result interface.
Figure 5-29 Scheme results
5.5.1 Solution Grouping
Scheme grouping tree: The project site, scheme grouping, and engineering scheme are displayed in a composite manner. The root node of the tree is the project site, and the branch is the scheme grouping, and the leaf node is the engineering scheme.
5.5.2 Solution Results
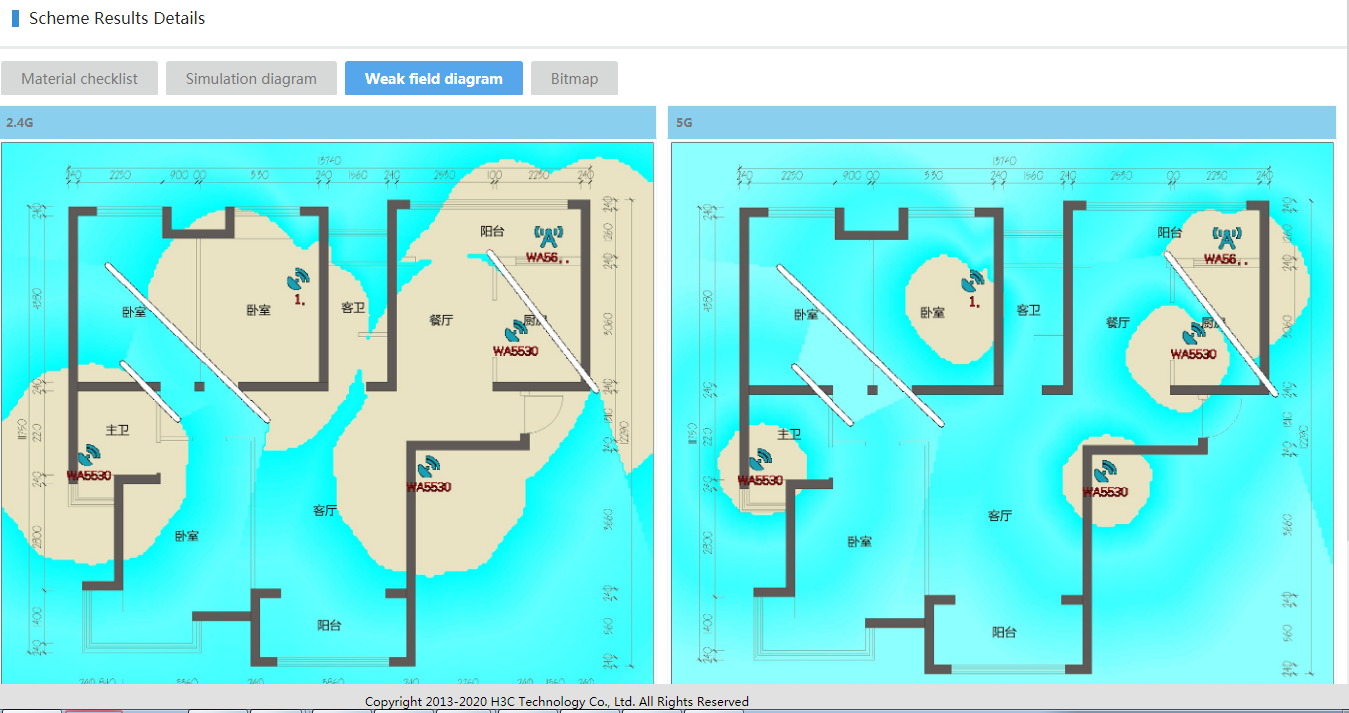
The result of the solution is a page that allows users to view the details of the solution quickly after the solution has been edited. It is divided into four parts by tabs: bill of materials, simulation diagram (to show signal strength), a weak field diagram (to show signal weak field), Bitmap (architectural plans and equipment placement points, not involving signal effect rendering).
(1) Click the scheme result button in the scheme operation bar to turn to the scheme result interface.
Figure 5-30 Enter the solution result page
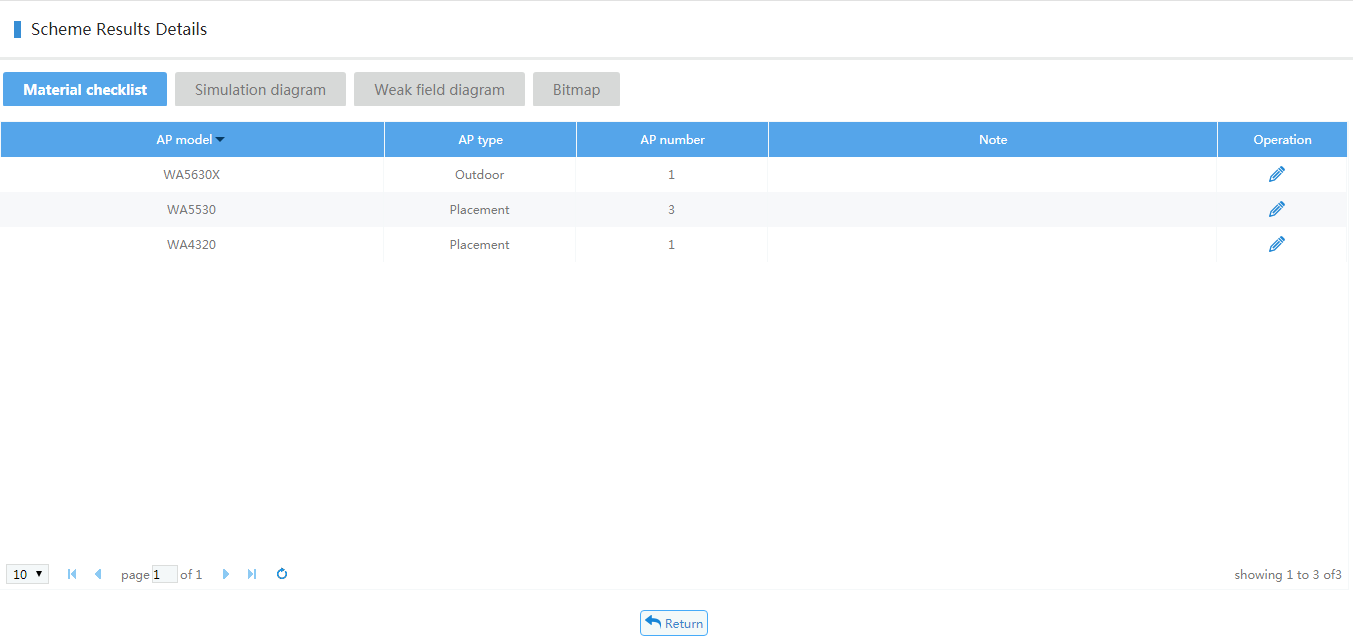
(2) Bill of materials: Only the AP equipment list required for the current solution is displayed, and only remarks can be edited. The list includes: AP model, type, quantity, remarks, operation.
(3) Modify material: Only the remarks can be edited.
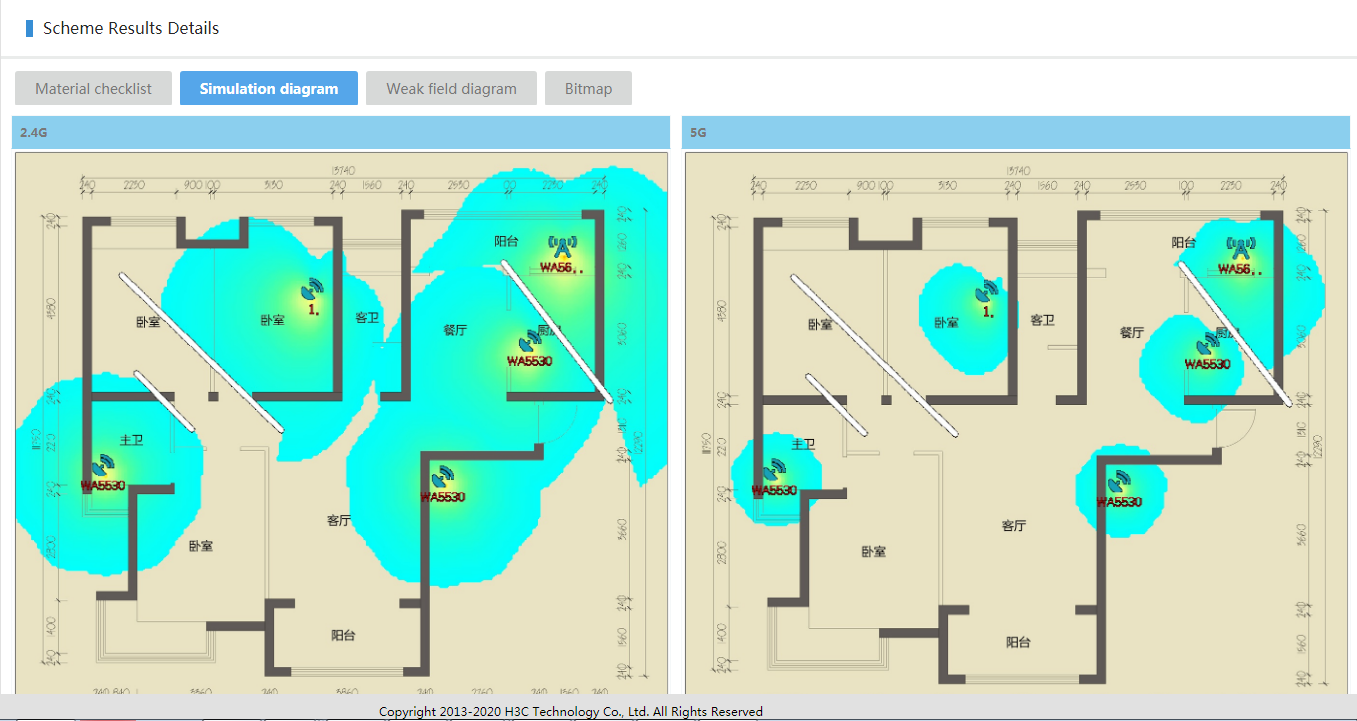
Simulation diagram: The simulation picture is a picture formed by rendering the images of obstacles, AP equipment and field strength. According to the field strength, the simulation diagram will be displayed softly according to the gradient and the boundary, and both 2.4G and 5G should be displayed. According to the attenuation of different obstacles and the power of the AP device, the simulation diagram will change accordingly.
Figure 5-31 Simulation diagram
(4) Weak field image: The weak field image is a rendered image of obstacles, AP equipment, and field strength. Unlike the simulation image, the weak field image focuses on signals that do not meet the requirements of the scene and the selected environment. The part that meets the conditions will not be rendered, and the part that not meets the conditions will be displayed in different colors according to the field strength gradient. Both 2.4G and 5G should be displayed.
Figure 5-32 Weak field diagram
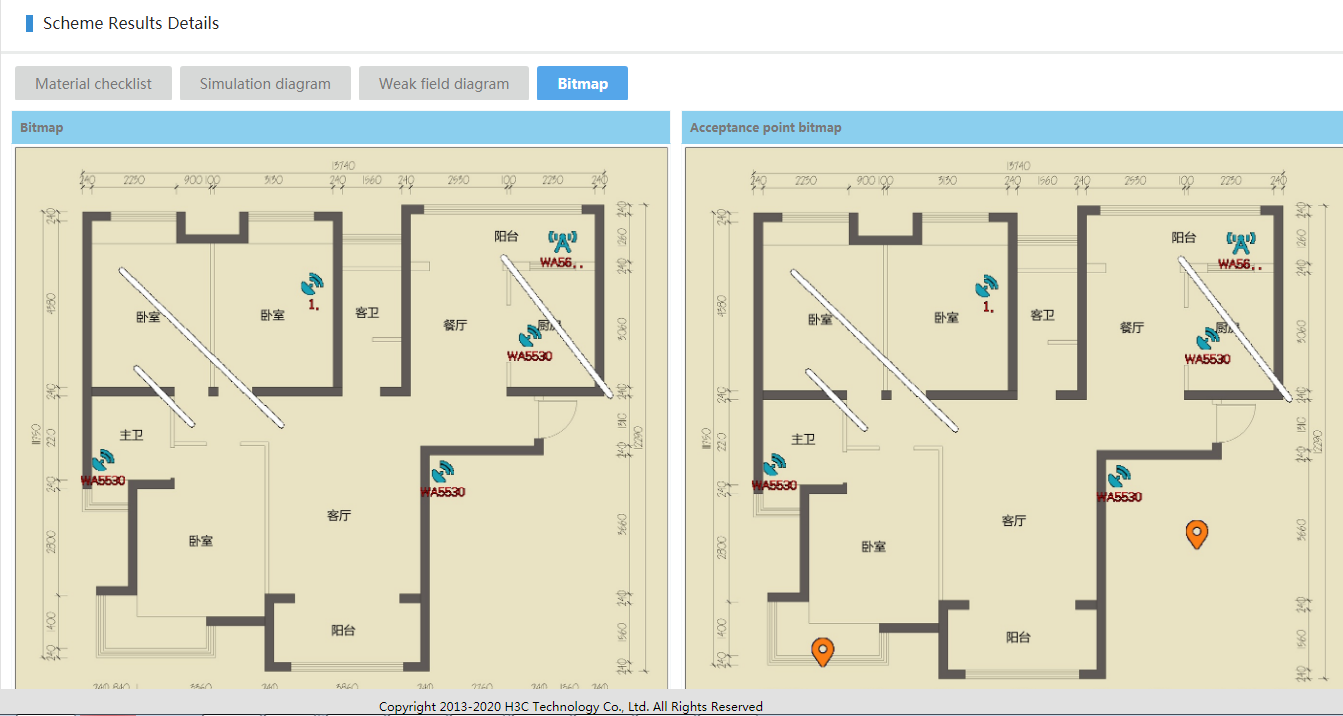
(5) Bitmap: The bitmap contains ordinary bitmaps and acceptance bitmaps. Ordinary bitmaps are a combination of obstacles, AP equipment and engineering survey original drawings. The acceptance point map is based on the point map with the acceptance point, and it’s purpose is to allow the site engineering survey and acceptance personnel to perform acceptance at a specific location.
Figure 5-33 Bitmap
Explanation:
The acceptance point map is based on the map with the acceptance point, and it’s purpose is to allow the site engineering survey and acceptance personnel to perform acceptance at a specific location.
5.5.3 Solution Designer
(1) Click the "Project Name" on the project site page or click the View Project Scheme button to turn to the project scheme page.
(2) Click the corresponding
icon![]() to pop up the Add Scheme button.
The input information requires the scheme name, industry classification,
environment name, and scheme description. Click the <Save and Design>
button to directly enter the [Solution Designer] interface. Or you can click
the scheme design button in the existing scheme operation bar, and create a new
tab to open the [scheme designer] page.
to pop up the Add Scheme button.
The input information requires the scheme name, industry classification,
environment name, and scheme description. Click the <Save and Design>
button to directly enter the [Solution Designer] interface. Or you can click
the scheme design button in the existing scheme operation bar, and create a new
tab to open the [scheme designer] page.
Figure 5-34 Solution Designer page
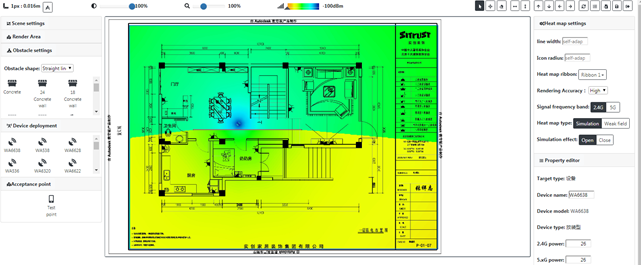
(3) Top toolbar: used to store the basic tools corresponding to the entire solution designer
(4) Re-importing the
engineering survey plan: Re-importing the original engineering survey plan will
overwrite the original engineering survey plan and simulation results. On the
Project Designer page, click the Import Engineering Survey Icon ![]() and select a local image file. Imported original engineering survey
plans, which supports zoom in and out, adjust transparency. In addition, the
imported engineering survey plan will also be selected when creating a new
scheme.
and select a local image file. Imported original engineering survey
plans, which supports zoom in and out, adjust transparency. In addition, the
imported engineering survey plan will also be selected when creating a new
scheme.
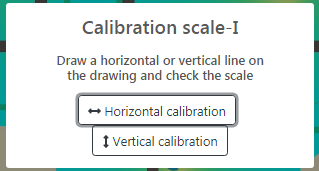
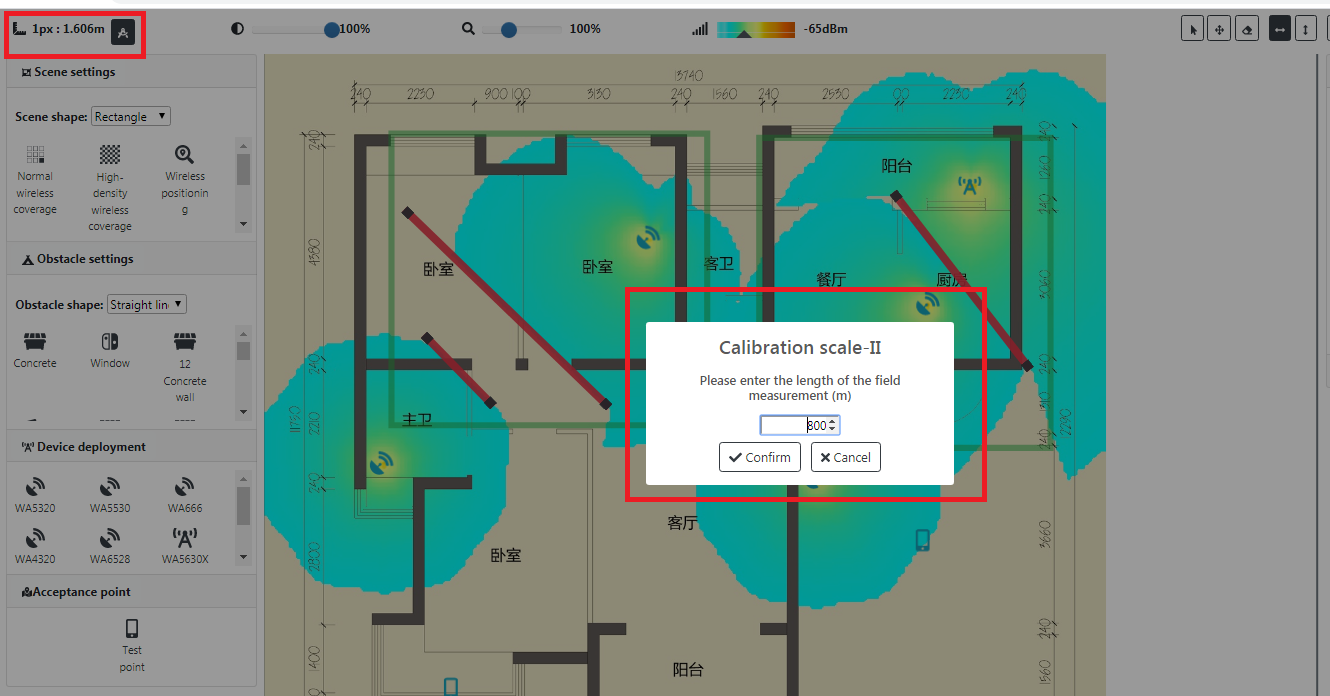
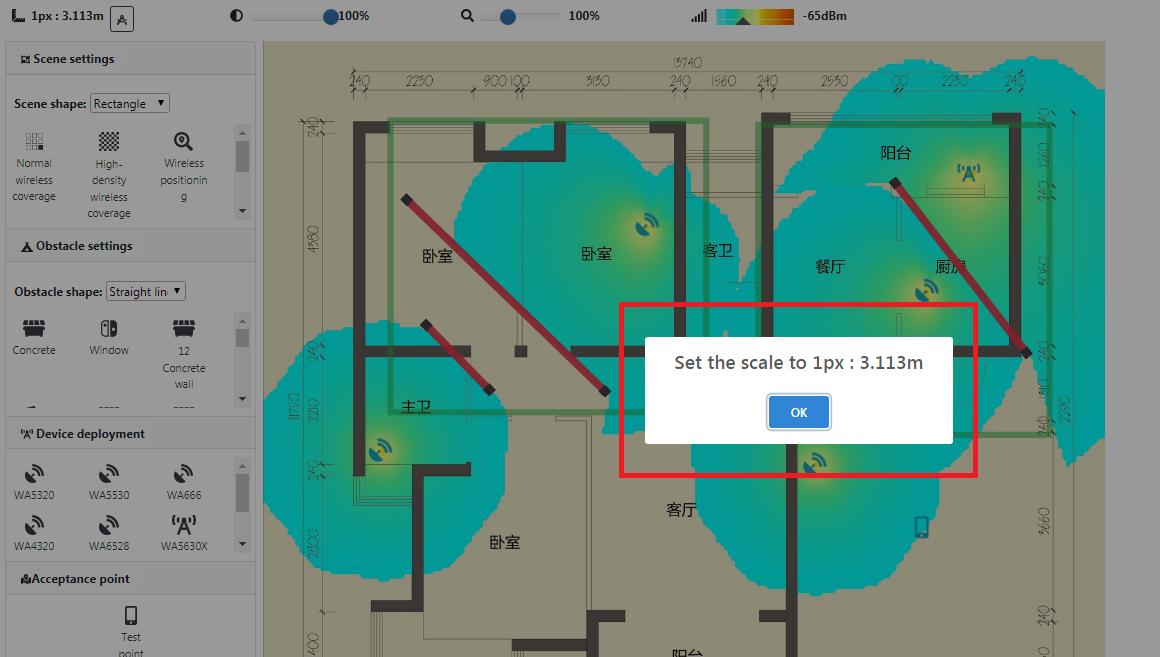
(5) Set the scale: Click the button to draw a line in the drawing area, and the length of this line in the original engineering survey corresponds to the actual length. After drawing this line, a pop-up box appears to set the actual length of the drawn length. Enter the designer page and force the user to set the scale. No operation can be performed without setting.
![]()
(6) Select button: The default state is the selection state. When other settings (such as scene drawing, obstacle icon, AP device icon, etc.) are selected, the selection state becomes the corresponding state. When other settings are not selected, they are selected status.

(7) Mobile drag and drop: used for mobile engineering survey drawings.
(8) Transparency: Select the transparency of 0-100 from the slider. When the transparency is 0, the original image is displayed. When the transparency is 100, the original image is invisible, but the transparency does not affect the simulation rendering.
![]()
(9) Magnification: There are large or small imported engineering survey drawings. The slider can adjust the zoom size of the engineering survey drawings.
![]()
(10) Horizontal line: When the horizontal line is selected, the horizontal line for drawing obstacles can only be parallel to the horizontal line. It does not affect the selection status and other setting status.
(11) Vertical line: When the vertical line is selected, the vertical line for drawing obstacles can only be perpendicular to the horizontal line. It does not affect the selection status and other setting status.

(12) Move up, down, left and right: When obstacles, AP devices, test points, and scenes are selected, you can use the move buttons to move up, down, left, and right. When it is not selected, the engineering survey is moved by default.
(13) Save / Cancel: It is used to save the scheme. Clicking Cancel will not save any operation of the scheme. It will automatically save the most recent operation by default in 30s. when there is no operation, It will not automatically be saved.
![]()
(14) Scene setting: It is used to divide the use scene of a certain part of the engineering survey map. Each scene has a minimum field strength intensity. Below this value, it will be displayed in the weak field diagram. The signal strength that meets this value will not be displayed, and multiple scenes can be set.
l Scene list: scene name + minimum field strength, displayed in the drop-down box;
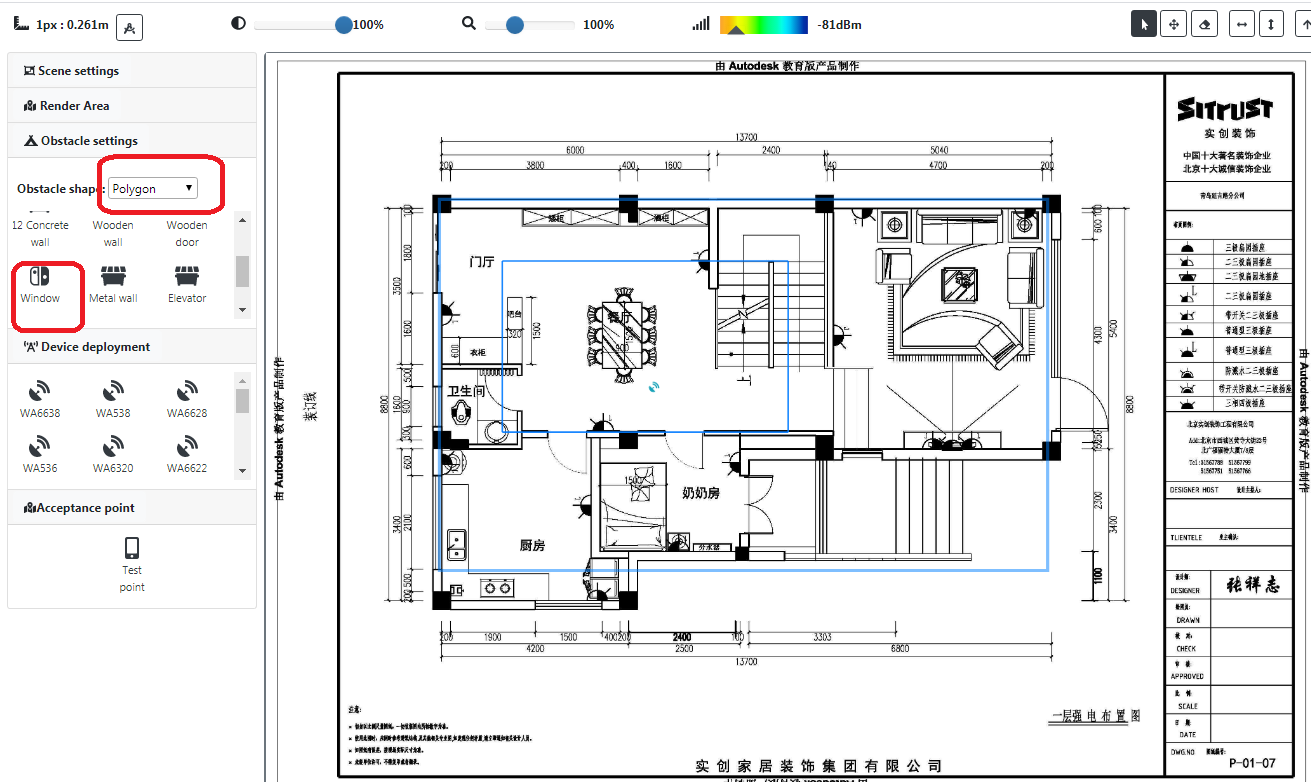
l Shape: Support rectangle and polygon.
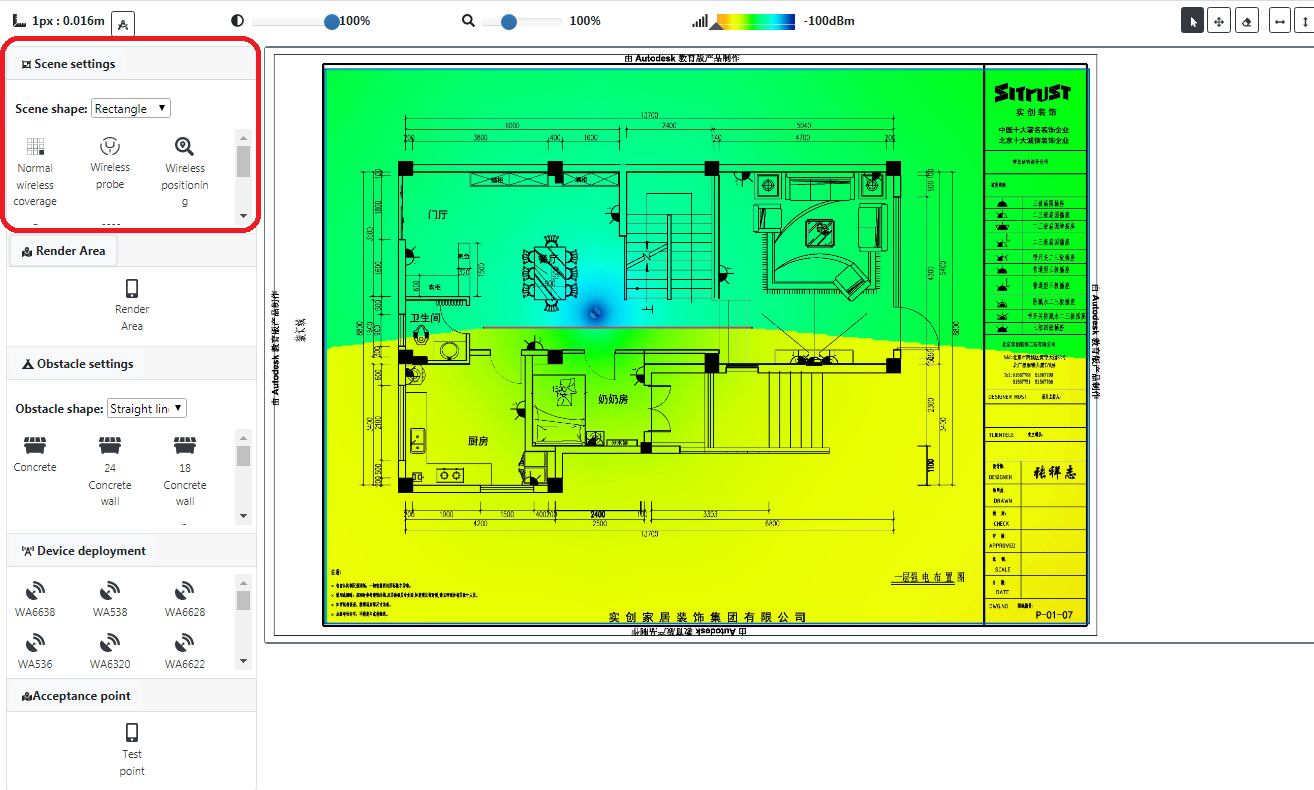
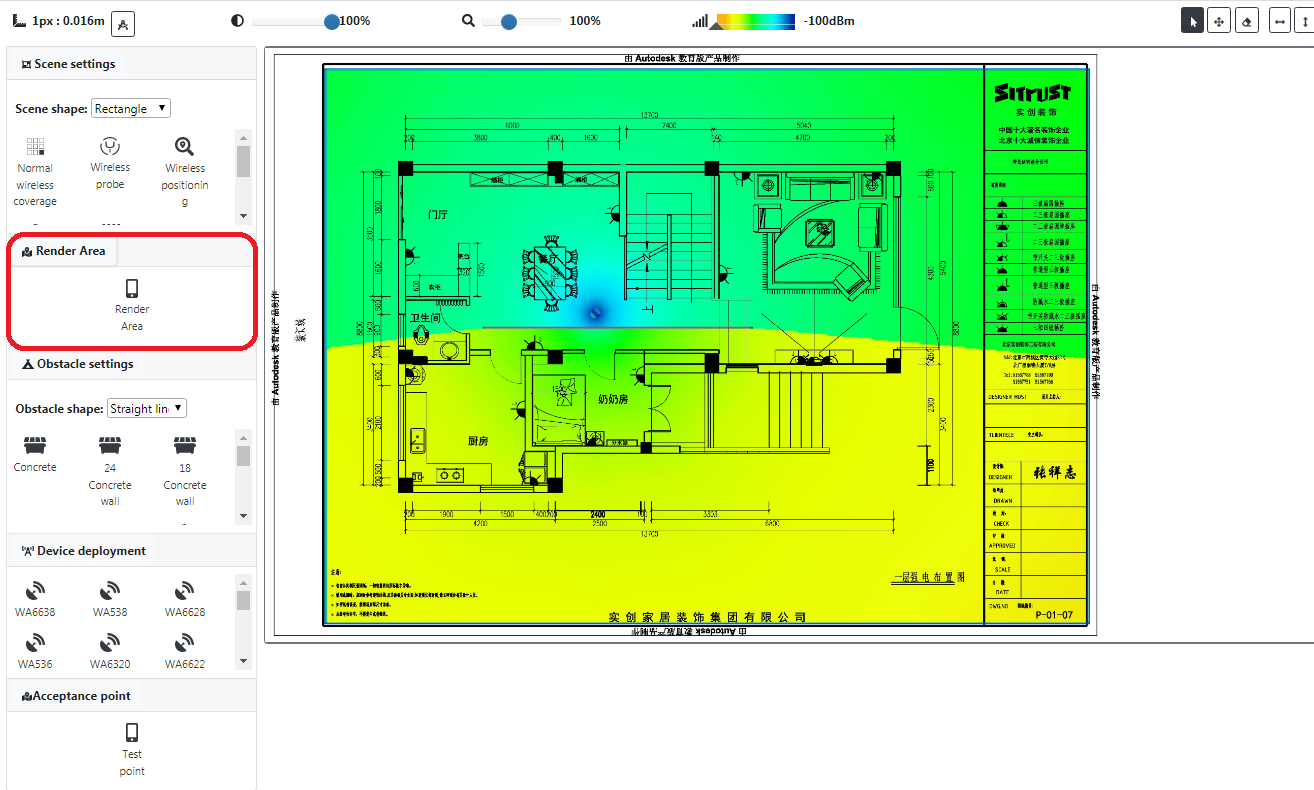
(15) Rendering scope: the rendering scope of the site survey drawing. Site map rendering only renders the part within the effective area. The excess part is not rendered.
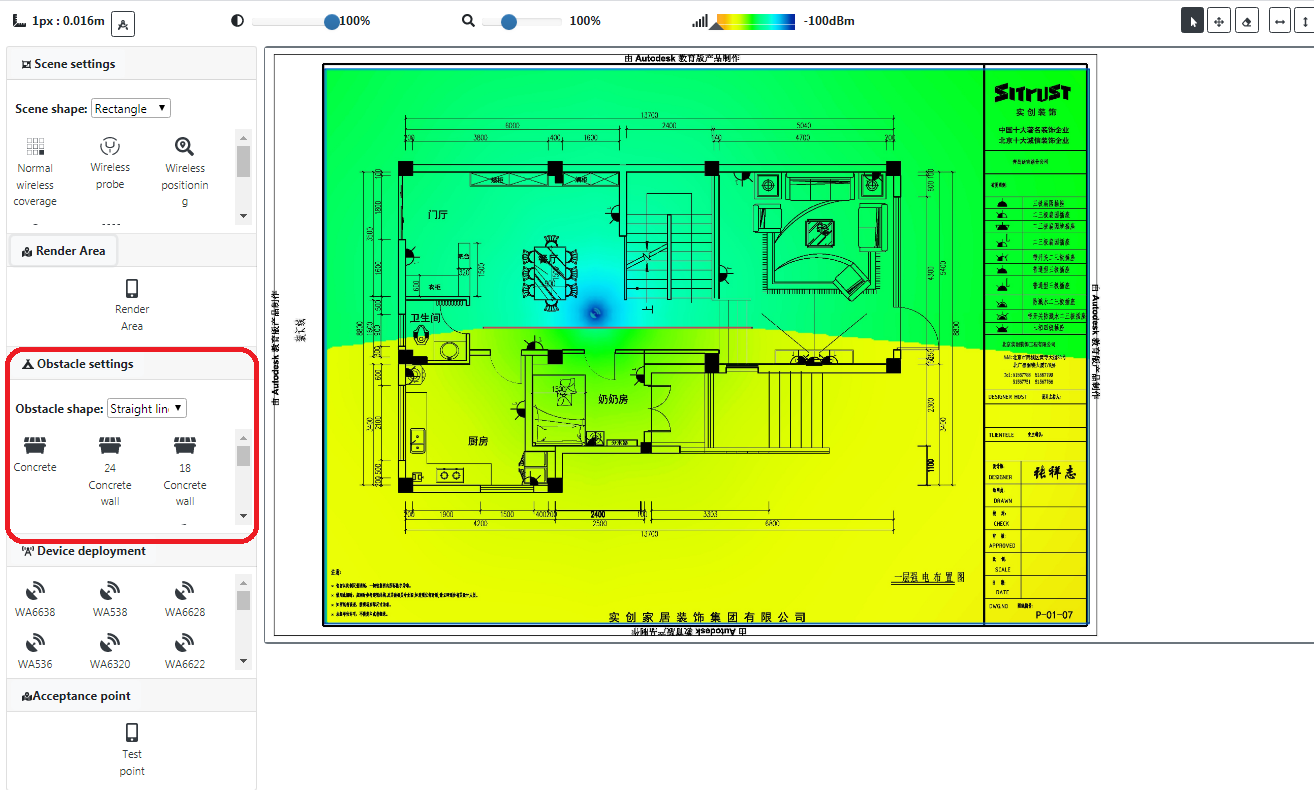
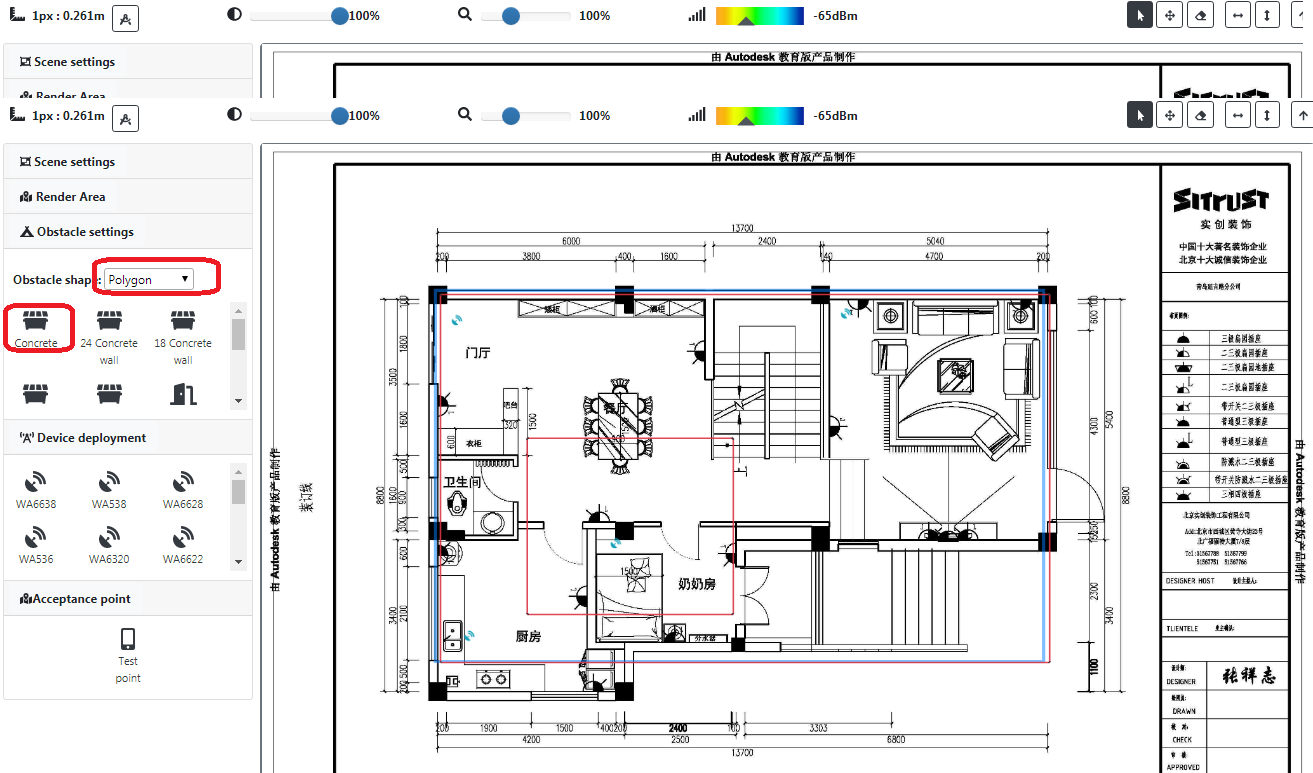
(16) Obstacle settings: draw obstacles and click on the corresponding obstacle icon to continue painting. According to the frequency of use, the four most used are listed first.
l Shape: straight line, polyline, rectangle;
l Obstacle icon: After selecting, it will always be in the state of drawing obstacles. Click again to cancel the state of drawing obstacles.
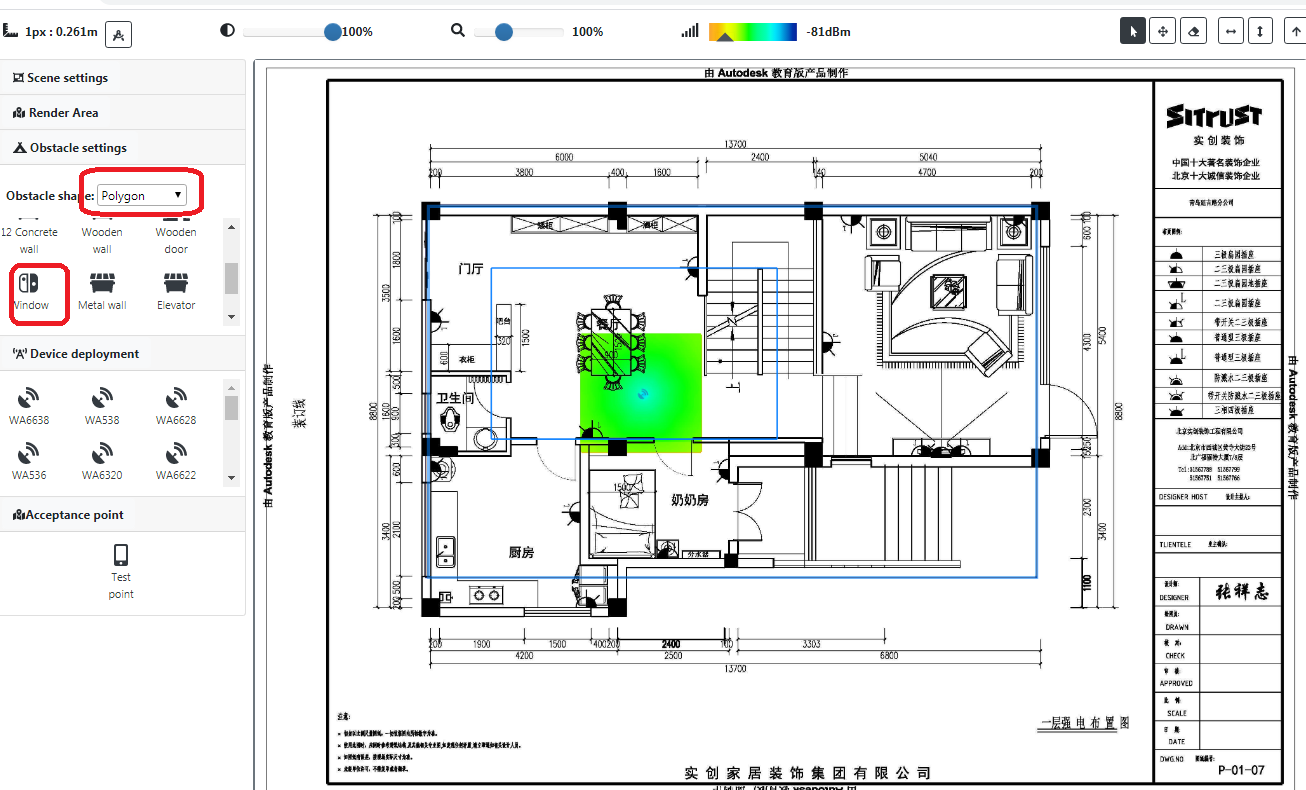
(17) Device deployment:
Device deployment is used to deploy and select AP devices. This type of device
is selected and can be continuously deployed in the drawing area. Device types
include placement type![]() , outdoor type
, outdoor type![]() , X-Share, panel type
, X-Share, panel type![]() , and engineer-defined type.
, and engineer-defined type.
l Device icon: According to the frequency of use, the most frequently used AP devices are listed in front.
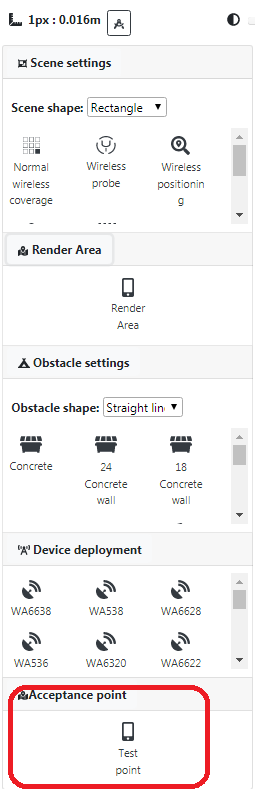
(18) Acceptance point deployment: The test point is a recommended test point drawn by the engineering survey designer for on-site engineering survey acceptance. The point map and test point location are transmitted to the non-dimensional APP in the background. And delete.
l Acceptance point icon: Click the test point icon. When it is in the state of drawing test points, it can be drawn continuously.
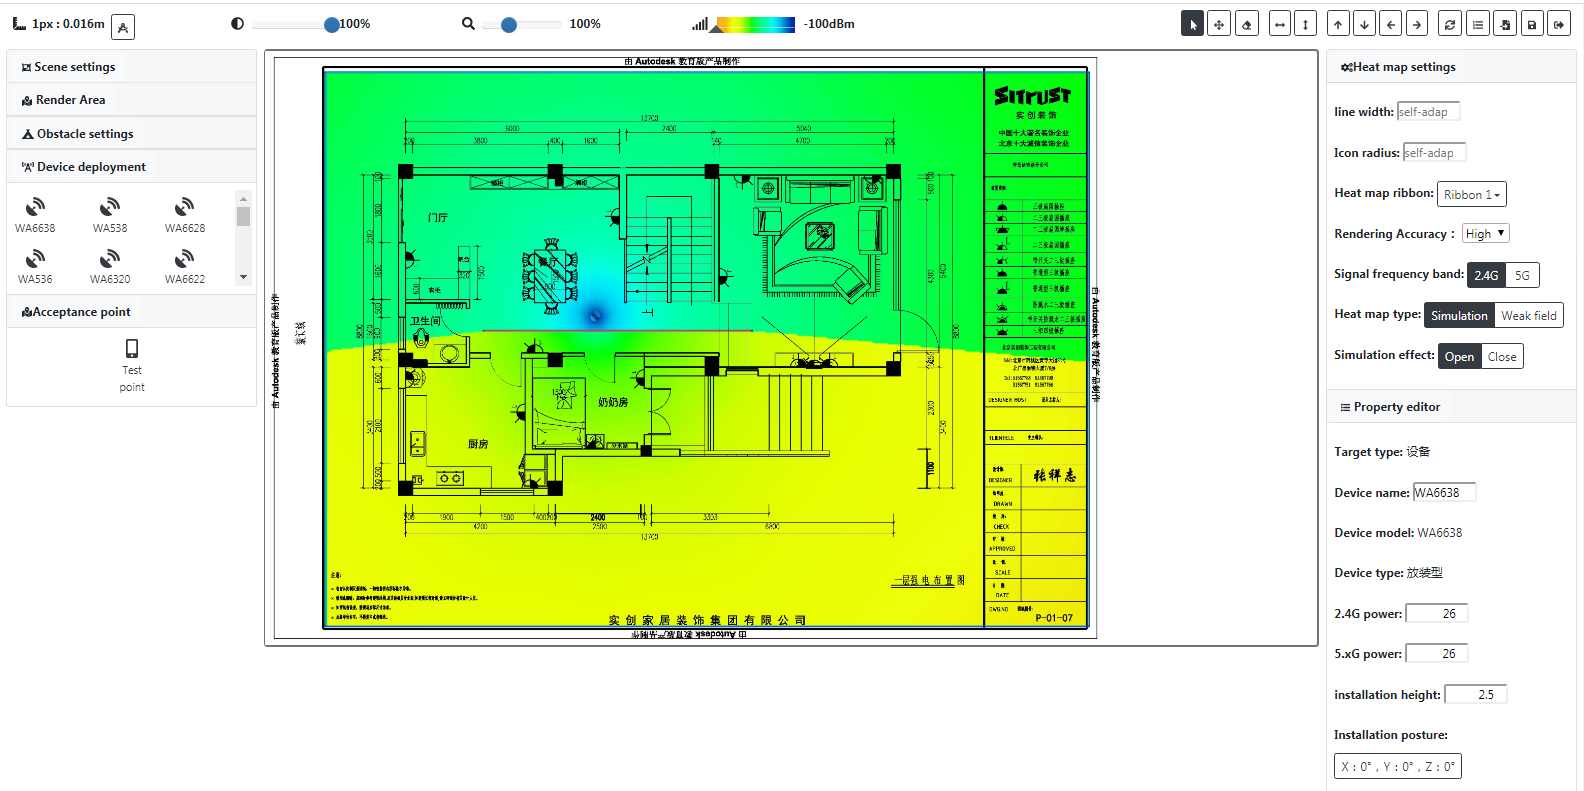
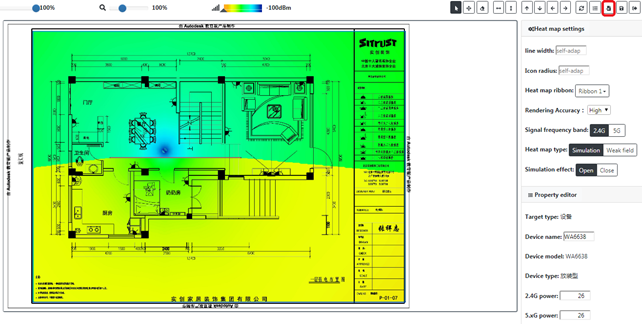
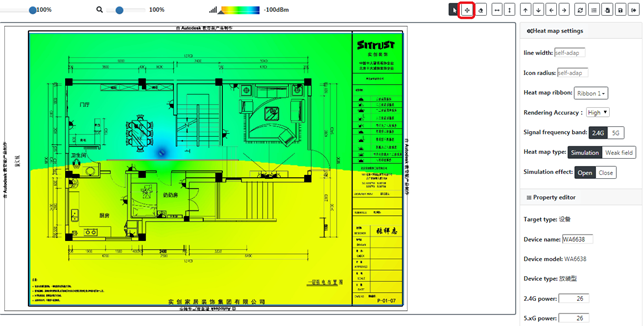
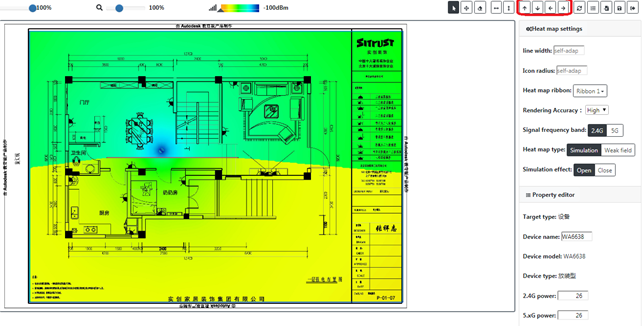
(19) Simulation diagram configuration: The simulation diagram configuration can show different simulation diagrams for different parameter configurations.
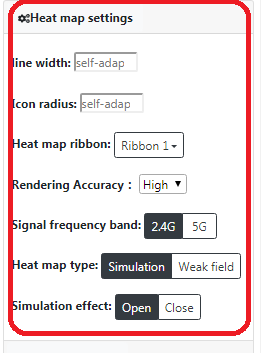
l Line width: Draw the line width of obstacles etc. in the picture.
l Picture radius: the picture radius of the device and test point.
l Enable simulation button: display simulation map when turned on, and display unrendered bitmap when turned off.
l Refresh button: If the AP device, obstacle attribute or position changes, only when you click the refresh button, the simulation picture will change accordingly.
l Frequency band selection: 2.4G, 5G. By default, 2.4G is selected, and only single selection is possible. When 5G is selected, click Refresh, and the simulation diagram will change accordingly.
l Heat map type: Currently, field strength map and weak field map are supported. The field strength map is a conventional simulation map, and the weak field map is a reversed field strength map. If no scene is set, the default field strength of the selected environment shall prevail. When the field strength is lower than the default value, the weak field map will be color-coded, while the part meeting the field strength is not be rendered. The parts that do not meet the conditions will be represented by the difference in color depth. Through the weak field diagram, you can quickly find out which parts of the diagram do not meet the specified field strength signal. If a scene is set, when a weak field map is selected, the part of the scene that is delineated will be rendered according to the default minimum field strength of the corresponding scene, and the part of the undefined scene will be rendered according to the minimum field strength of the environment. When the scene is set, in the weak field graph, there will be a prompt when the signal is not up to the standard.
l Heat map ribbon: Multiple color series can be selected for the ribbon of the simulation map
l Rendering accuracy: divided into three levels: high, middle and low. Corresponds to the jagged fineness of the actual rendering drawing.
l Default field strength of the environment: When creating a new solution, a different environment is selected. The default field strength of the environment inside the designer will change accordingly. The designer can support manual adjustment of the default field strength.
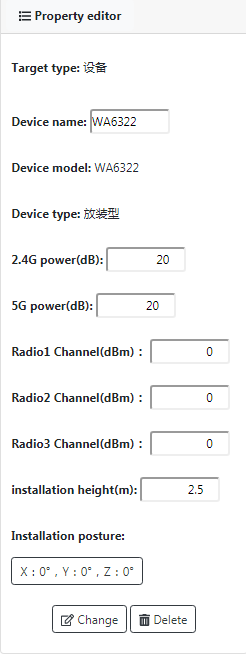
(20) Property toolbar: Property editor
l Scene: Click the drawing mark of the scene, and the attribute toolbar on the right will display the modifiable attributes, including the scene list, and the manual adjustment of the default minimum field strength. You can also click on the scene that has been demarcated to support modifying scene properties.
l Obstacles: Click the drawing markers of the obstacles, and the attribute toolbar on the right will display the modifiable attributes, including the list of obstacle types, thickness, attenuation, and manual adjustment of the attenuation. When adjusting, the thickness and attenuation will change accordingly. You can also click on obstacles that have already been deployed to support modification of obstacle attributes.
l AP device: Click on the drawing mark of the AP device, and the property toolbar on the right will display the modifiable properties, including model list, manual adjustment of power, power, installation height, Radio channel and manual adjustment of installation posture. You can also click the AP device that has been deployed. It supports modifying the attributes of the AP device.
(21) Properties toolbar: Installation posture adjustment page.
X: represents the up and down angle offset
Y: represents the left and right angle offset
Z: represents the rotation angle offset
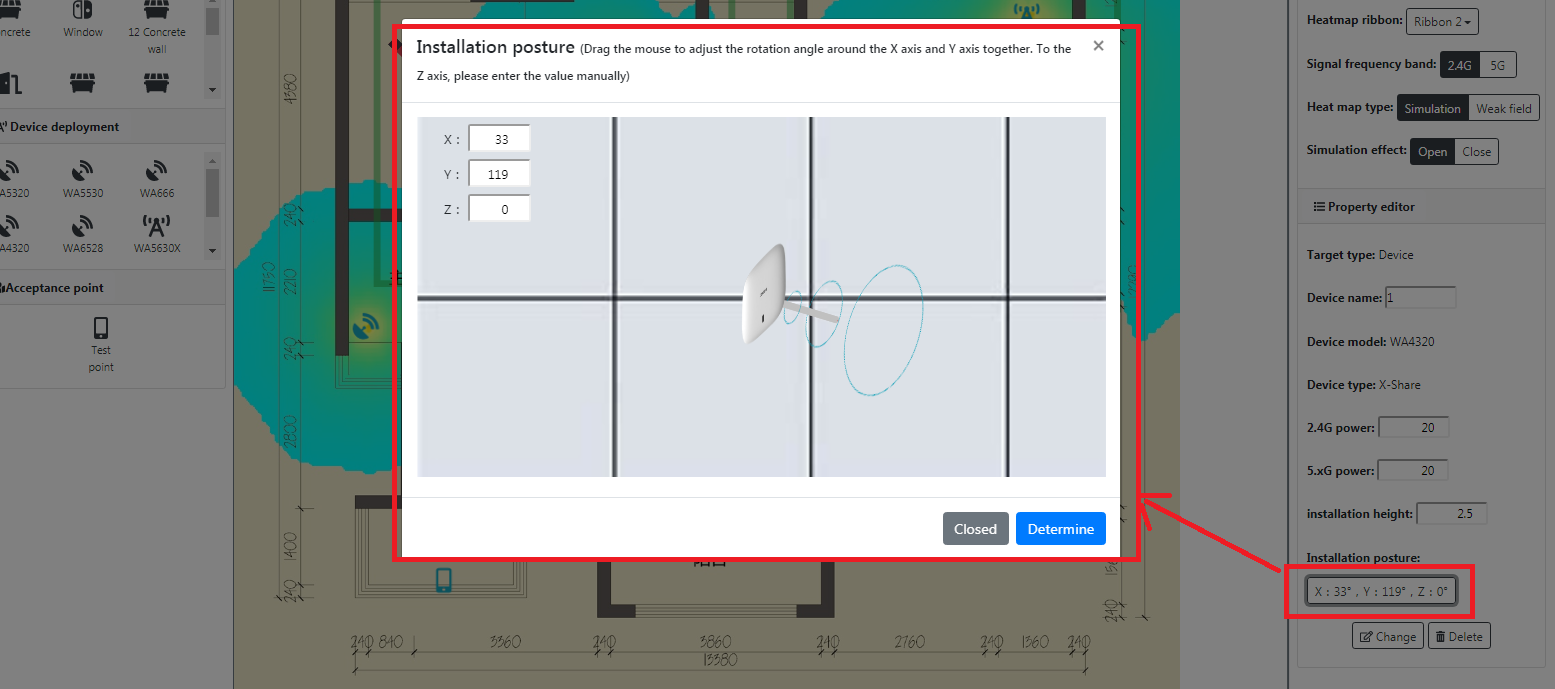
Steps: Click the installation gesture to pop up the installation gesture page.
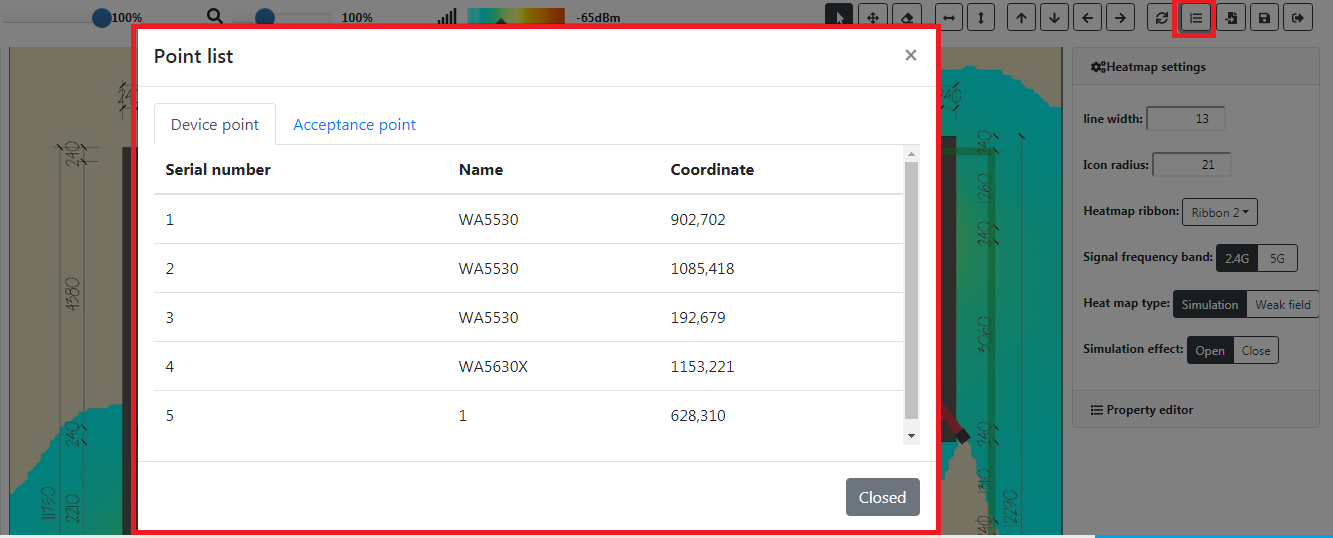
(22) Statistics column: The statistics column is located above the entire designer, including AP point list and test point list.
(23) Drawing area: The drawing area is the representation area of the scheme designer ,which Contains the original engineering survey map, AP equipment, obstacles, scene division, and test points.
parameter::
·
Scale bar, format is 1px : ? mm. Click the calibration button, draw a
horizontal or vertical line on the drawing, and check the scale. It effects
rendering parameters.
· Transparency, adjust the transparency of the
background image. It effects rendering parameters.
· Magnification, adjust the zoom ratio of the
effect picture.
Field strength, adjust the field strength
threshold of the rendering effect. It effects rendering parameters.
· Draw lines horizontally, lines can only extend
horizontally.
· Draw lines vertically. Lines can only extend
vertically.
· Pan up, Y-coordinate of graphic element
composition point -1.
· Pan down, Y-coordinate of graphic element composition point +1.
· Pan left, X-coordinate of graphic element composition point -1.
· Pan right, X-coordinate of graphic element composition point +1.
· Import, upload the local graphic design as the background image of the designer.
· Refresh, submit designer configuration parameters and graphic elements, and regenerate renderings.
· Save, save the current editing status of the designer.
· Exit, exit the designer.
5.6 Basic data
The basic data is the various influencing factors in order to facilitate the custom scheme designer, users can add, modify and delete various parameters defined by themselves.
5.6.1 AP device management
AP device management mainly includes the functions of adding, deleting, modifying, and restoring (system default devices) AP device related information. It supports users to customize and add required devices, which makes AP device deployment and BOM editing more flexible.
Explanation:
Query by page. By default, the AP devices are sorted in ascending order. Only the preset AP device data and data created by the currently logged in user are visible.
(1) Log in to the H3C WSS cloud engineering survey and select the [Basic Data / AP Device Management] menu item in the left navigation to enter the AP device management page.
(2) List display: AP
model, 2.4G transmit power, 5G transmit power,Radio1 channel, Radio2 channel, Radio3
channel, supportting channel, AP type, system preset (yes, no), AP description,
operation bar (modify![]() , delete
, delete![]() , restore default
, restore default![]() )The system default AP device attributes
support restoring default values, but do not support deletion.
)The system default AP device attributes
support restoring default values, but do not support deletion.
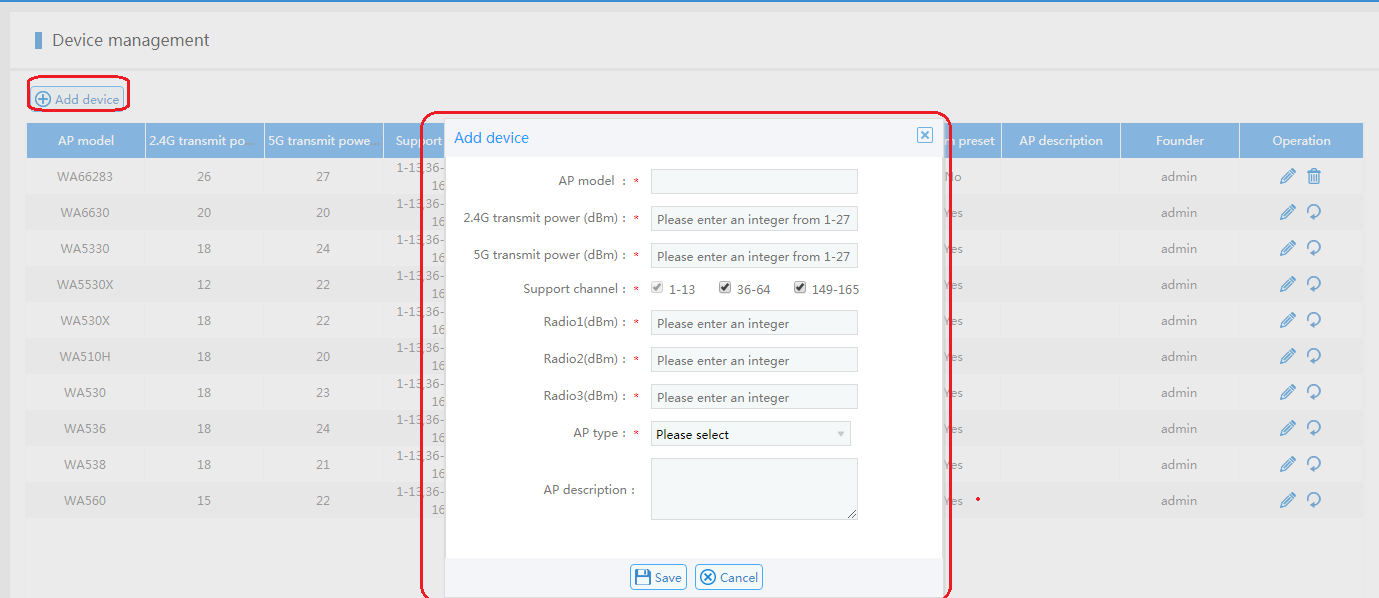
(3) Add device: Click the <Add Device> button to pop up the Add Device window. The input information includes the AP model, 2.4G transmit power (dBm), 5G transmit power (dBm), Radio1 channel, Radio2 channel, Radio3 channel, and AP description. Select the supported channel (1- 13, 36-64, 149-165), AP type.
Figure 5-35 Add AP device
(4) Modify device: Click
the icon of the corresponding operation column![]() of the device to pop up the modify device window. The modified
attributes include AP model, 2.4G transmit power (dBm), 5G transmit power
(dBm), Radio1 channel, Radio2 channel, Radio3 channel and support channel (1-13,
36- 64, 149-165),Radio channels, AP description. The system's default APs do
not support modification types. Custom APs can modify AP types.
of the device to pop up the modify device window. The modified
attributes include AP model, 2.4G transmit power (dBm), 5G transmit power
(dBm), Radio1 channel, Radio2 channel, Radio3 channel and support channel (1-13,
36- 64, 149-165),Radio channels, AP description. The system's default APs do
not support modification types. Custom APs can modify AP types.
(5) Delete device: Click
the icon![]() in the corresponding operation column of
the device to delete the device.
in the corresponding operation column of
the device to delete the device.
Explanation:
The system default device does not support deletion.
(6) Restore default device: In the device list whose status is the system default, there is a function to restore the default in the operation bar.
parameter:
·
AP model: Model of wireless network access device.
· 2.4G transmit power (dBm): Radio frequency
(Radio Frequency) means the electromagnetic frequency with long-distance
transmission capability that can radiate into space. 802.11b / g in the IEEE
802.11 wireless local area network protocol works in the 2.4GHz radio frequency
band.
5G transmit power (dBm): Radio frequency (Radio
Frequency) refers to electromagnetic frequencies that have long-distance
transmission capabilities and can radiate into space. 802.11a in the IEEE
802.11 wireless local area network protocol works in the 5GHz radio frequency
band.
· Support channels: According to different working
frequencies, radio frequency can be divided into channels (representing the
transmission channel using wireless signals as transmission media), and each
channel corresponds to a frequency range.
5.6.2 Obstacle settings
Obstacle settings support user-defined addition, deletion, and modification of obstacle attributes (the default type of the system cannot be modified and deleted).
Figure 5-36 Obstacle settings
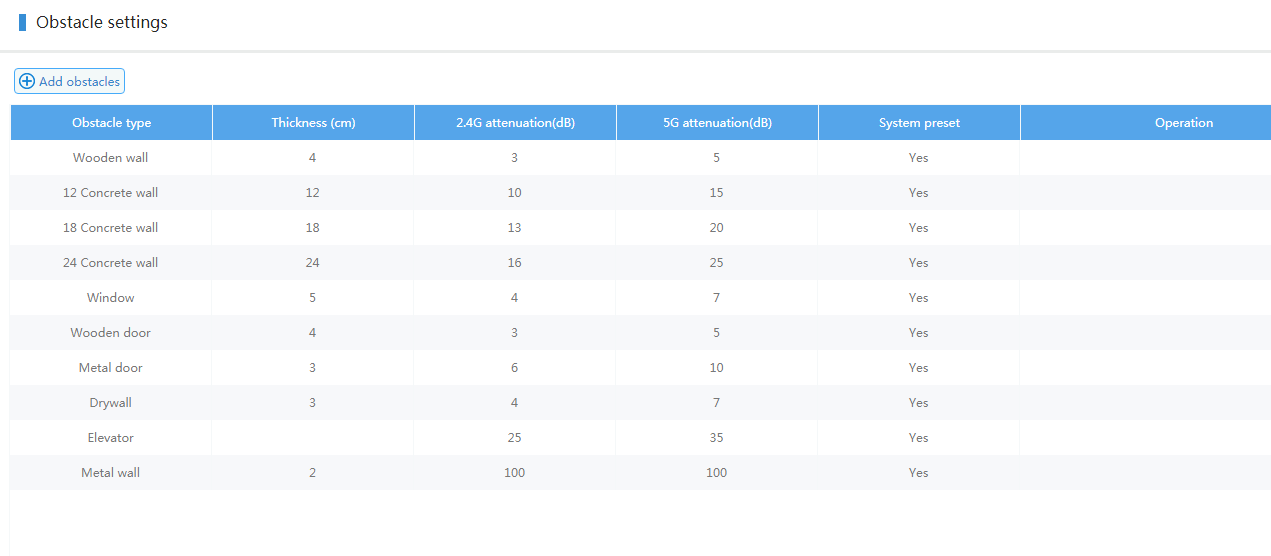
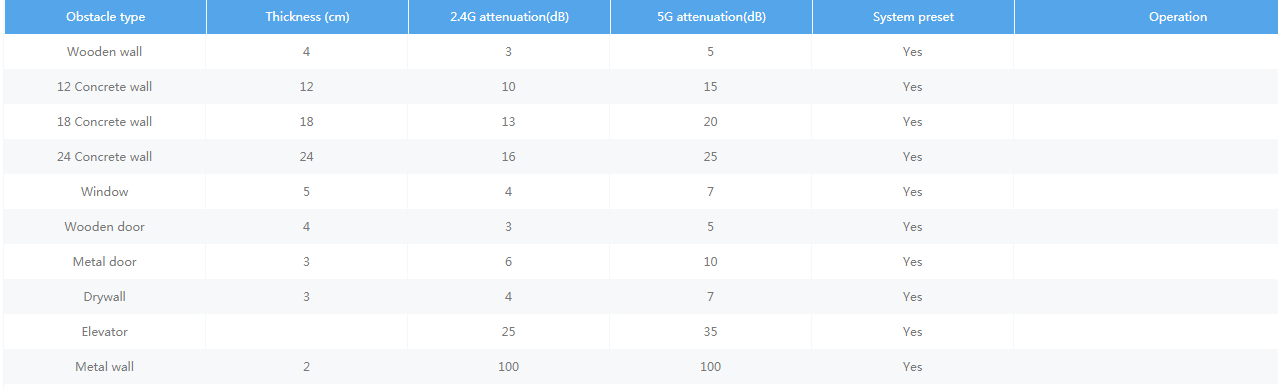
(1) List display: including obstacle type, thickness, 2.4G attenuation, 5G attenuation, system preset (Yes, No), operation bar (Modify, Delete), as shown in the figure below.
Figure 5-37 List of obstacles
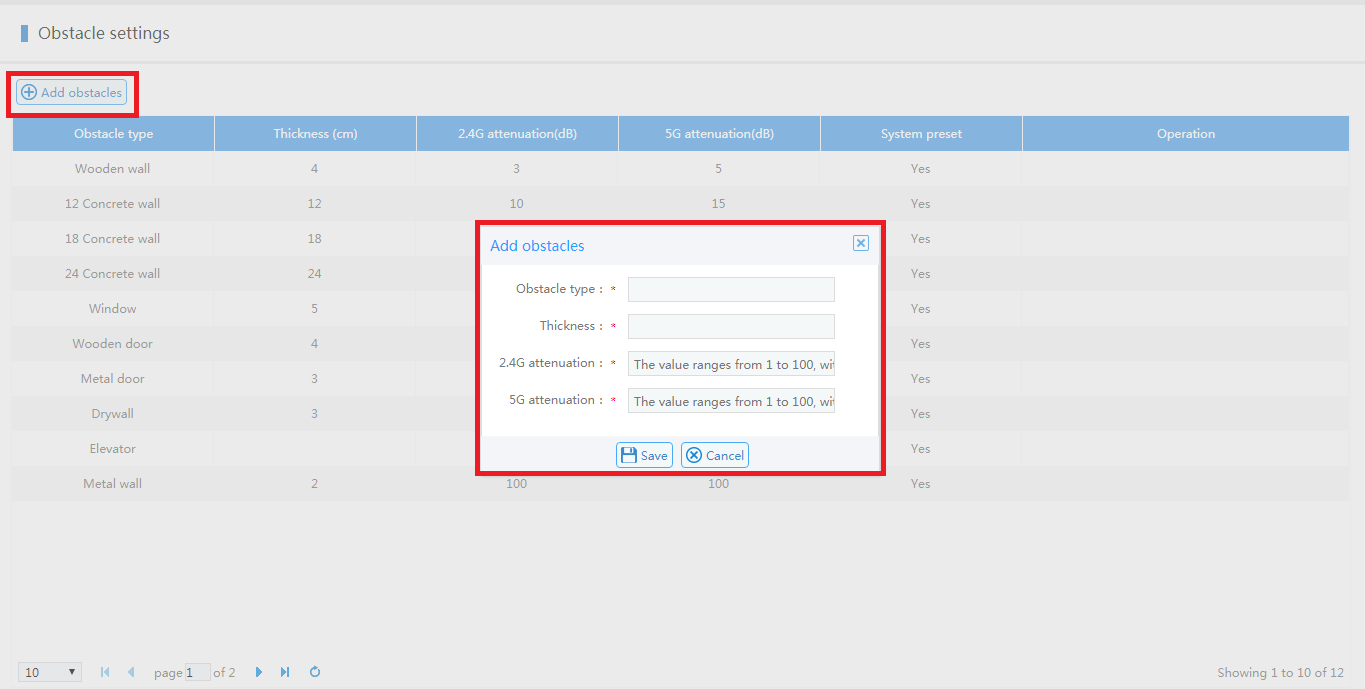
(2) Add obstacles: including obstacle type, thickness, 2.4G attenuation, 5G attenuation.
Figure 5-38 Adding obstacles
(3) Modify obstacles: include obstacle type, thickness, 2.4G attenuation, 5G attenuation. The default obstacles cannot be modified.
(4) Deleting obstacles: The default obstacles in the system cannot be deleted.
parameter:
l Obstacle type: It prevents analog mesons that hinder wireless signal transmission, and is used to better simulate the real scene environment.
l Thickness (cm). Obstacle thickness.
l 2.4G attenuation (dB): 2.4GHz RF field strength attenuation.
l 5G attenuation (dB): 5GHz RF field strength attenuation.
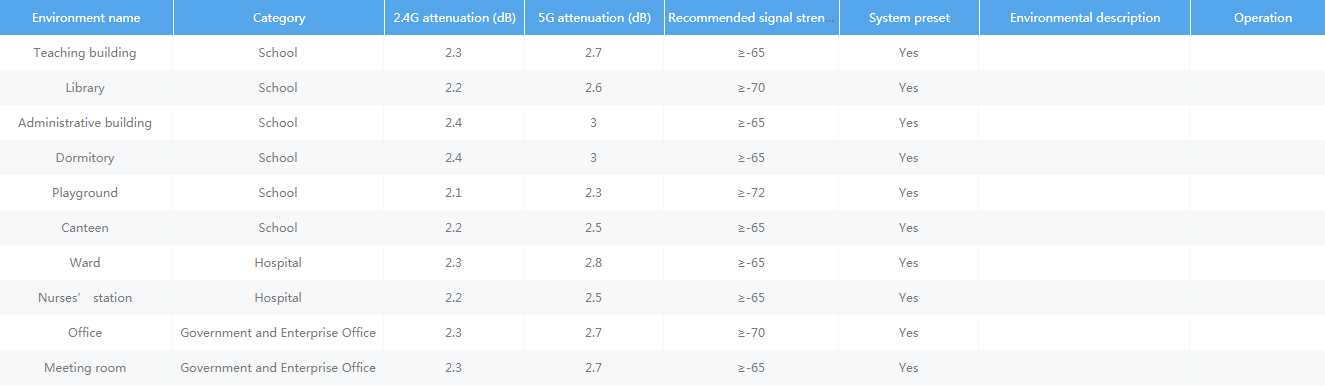
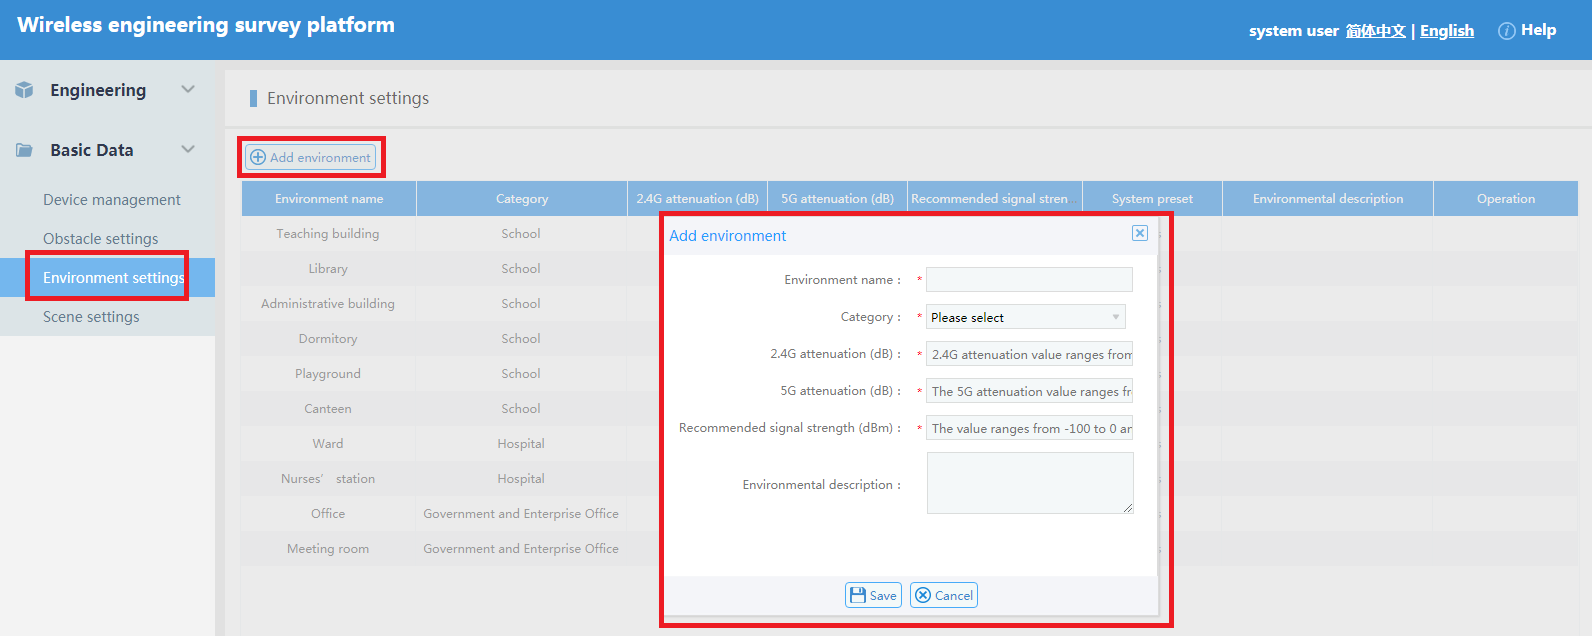
5.6.3 Environment Settings
Environment settings support user-defined addition, deletion, and modification of environment attributes. The default type of the system cannot be modified or deleted.
(1) List display: Including environment name (one industry corresponds to multiple environments), industry classification (9 categories: school, hospital, government office, hotel, airport, stadium, production scene, outdoor, others), 2.4G attenuation (dB), 5G attenuation (dB), recommended signal strength (dBm), setting status, environment description, operation (modification, deletion).
Figure 5-39 Environment settings
(2) Add environment: The pop-up add environment page contains the environment name, environment description, attenuation coefficient, and default minimum field strength. All fields are required except the environment description.
Figure 5-40 Add environment
(3) Modify environment: The pop-up window to modify the environment page contains the environment name, environment description, attenuation coefficient, and default minimum field strength. All fields are required except the environment description.
(4) Delete environment: The default environment of the system cannot be deleted.
5.6.4 Application scenario settings
Application scenario settings support user-defined addition, deletion, and modification of environment attributes. The default scenario of the system cannot be modified or deleted.
(1) List display: including scene name, suggested signal strength, system preset, scene description, operation (modify, delete).
Figure 5-41 Application scenario settings

(2) Add scene: The popup add scene page contains scene name, scene description, and default minimum field strength, except for the scene description, which are required fields.
(3) Modify scene: Popup window to modify scene page, including scene name, scene description, default minimum field strength, except for scene description are required fields.
(4) Delete environment: The default environment of the system cannot be deleted.
5.7 General Procedure of Drawing Scheme
(1) New project (required): First enter the system to create a new project. Fill in the project name and project description.
(2) New scheme (required): After the project is newly created, click the OK button to turn to the project scheme page of the newly created project site. At this time, the page only has the root node and project name.
l At this time, you can create a new group or plan at the root node. You need to select the environment when you create a new plan.
l You can also continue to create a new group or scheme under the newly created group. After you click OK to create a new scheme, a new browser tab opens the scheme designer.
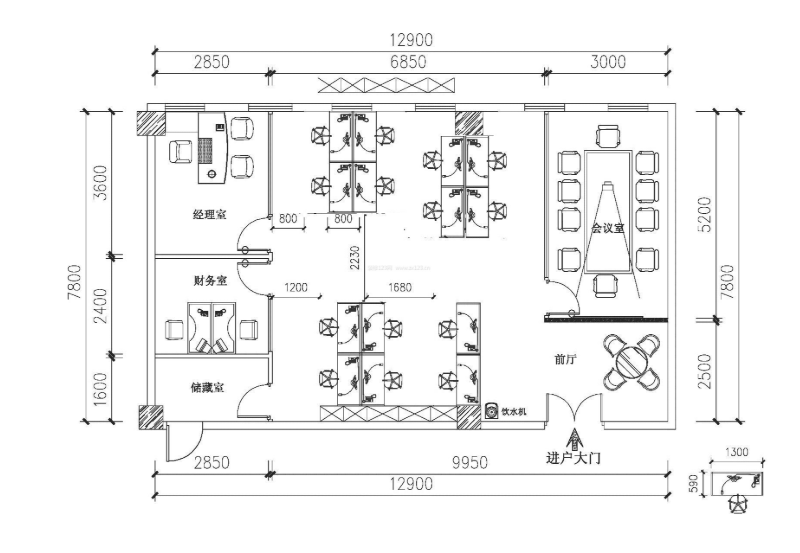
(3) Import engineering survey plan (required): The scheme designer page is the core page of the entire cloud engineering survey system. First, import the engineering survey plan and select the original engineering survey plan for the target engineering survey.
(4) Set the scale (required): Draw a line corresponding to the actual length on the engineering survey plan. After setting the scale, the heat map rendering will reflect the rendering length according to the set scale.
(5) Scene setting (optional): The user can set what kind of scene an area is in the engineering survey map, and one scene can set multiple scenes. When the scenes overlap, the minimum default field strength is the highest. The default minimum field strength of the scene does not conflict with the default minimum field strength of the entire environment. When a scene exists, the scene prevails.
(6) Obstacle settings (required): According to
the original engineering survey plan, the corresponding obstacles need to be
drawn in the drawing area. You can choose the type of obstacle (supporting
customization) and shape (straight line, polyline, rectangle).
(7) Equipment deployment (required): According to
the size of the actual engineering survey object and their own experience, the
engineering survey personnel lay out the AP equipment at the corresponding
location.
(7) Test point deployment (optional): According to the signal strength and experience, the engineering surveyor marks the test points on the engineering survey plan, which is convenient for the inspection personnel to find the test points purposefully during the acceptance.
(8) Refresh (required):
Click the refresh icon ![]() at the top right of the page to refresh
the rendering.
at the top right of the page to refresh
the rendering.
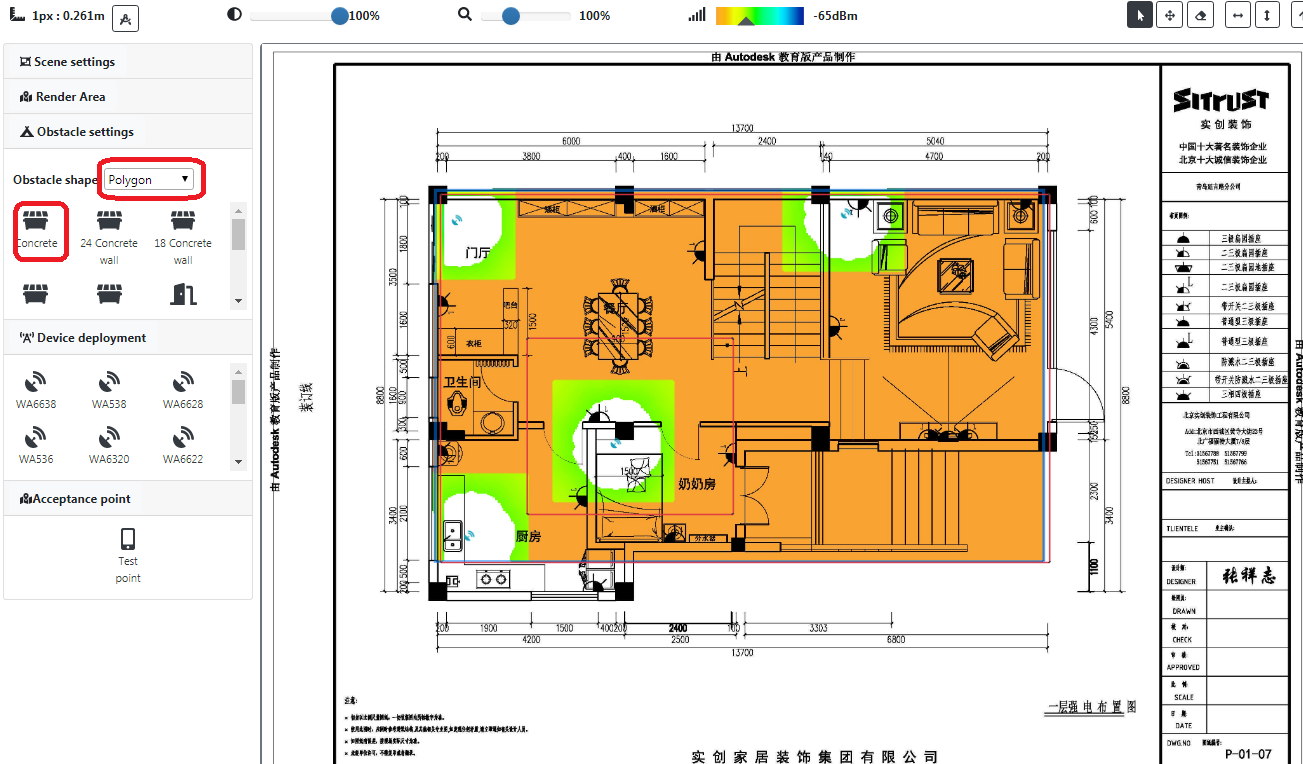
(9) Turn on simulation (required): After the obstacles and AP devices are deployed, turn on the simulation, and you can see the simulation map formed after rendering, which represents the signal intensity according to the color gradient. At the same time, you can select the frequency band, the type of simulation picture, and the color system.
6 Rendering example
In the H3C cloud engineering survey, the rendering area is the core which is used to complete signal simulation and obstacle simulation rendering.
Before the deployment of WLANs, engineers could not clearly know the number of devices deployed. Only after surveying and indexing the coverage sites could the signals and numbers of devices such as APs and antennas be determined. At the same time, through surveys and index calculations, the deployment positions of APs and antennas can be determined. These can be simulated through H3C cloud engineering surveys, which greatly reduces the manpower and material resources invested in engineering surveys.
6.1 Set the obstacle type to concrete, rectangular
Figure 6-1 Rectangular 2.4GHz concrete
6.2 Set the obstacle type to glass window, straight
Figure 6-2 Straight 2.4GHz glass window